When you display a Time History result by right-clicking on the output (in a browser An alternative view of a GoldSim model, in which elements are displayed in a tree, and organized either hierarchically, or by type. or the output interface), or the element (if the output is the element's primary output For an element with multiple outputs, the output that has the same name as the element.) and selecting Time History Result... from the context menu., by default, a chart will be displayed.
You can view a Time History Table by pressing the Display Table button when viewing a chart.

Note: When viewing a Time History Result element A Result element that shows the history of a particular output as a function of time., the element "remembers" the last type of view that was displayed, and displays that view when you double-click on it.
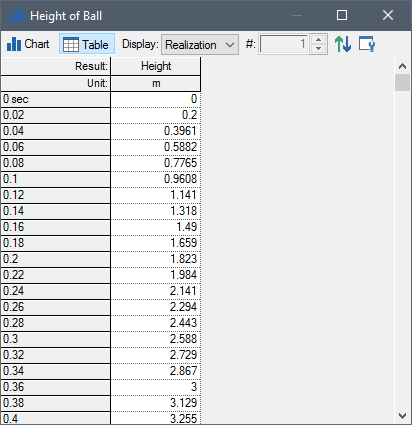
A Time History Table looks like this:

For multi-realization A single model run within a Monte Carlo simulation. It represents one possible path the system could follow through time. runs, there are three header rows. The first shows the Label for the result; the second shows the unit; and the third identifies exactly what is being displayed (e.g., a realization or a specific statistic). For single realization runs, the third header row is not shown (as it is not applicable).
The first column then shows the plot points Points in time at which the value of outputs are saved for plotting time history data. being used (i.e., scheduled timesteps Timesteps that are directly specified by the user prior to running the model. at which point values are saved). Each row represents a separate plot point (a result value that was saved at a particular point).
What is displayed in the first column is a function of two things:
- Is the Time Display Setting (in the Properties dialog) set to "Simulation Time", "SubModel Time" or "Reporting Periods"? In the first two cases ("Simulation Time is the default and the only option for interactive results), the first column contains elapsed times or dates. In the last case, the first column contains Reporting Period names.
- Is the Time Basis in the Simulation Settings dialog "Elapsed Time" or "Calendar Time"? In the former case, the first column displays elapsed times. In the latter case, the first column displays dates.
You can increase or decrease the width of a column by dragging the line separating columns to the right or to the left, respectively. If the column is too narrow to display the contents of a cell, holding the cursor over the cell displays a tool-tip with the contents.
The Time History Table has a variety of buttons and controls at the top of the window. Some of items are always present, while others are only shown under certain circumstances (e.g., when viewing multiple realizations and/or multiple outputs).
The following three buttons are always available:
Display Chart: Selecting
this button switches to a Time History Chart view of the result. Note that when
viewing a table, the Display Table button appears selected; when viewing a
chart, the Display Chart button appears selected.
Edit Properties: This
provides access to the Result properties dialog.
Sort: This button allows
you to sort the rows based on a selected column. 
Several additional points should be noted regarding Time History Tables:
- Conditions are displayed in tables as either 1/0, true/false, True/False, TRUE/FALSE, on/off, or High/Low. You select which of these pairs to use on the Results tab of the Options dialog (accessed via Model |Options... from the main menu).
- You can control the number of significant figures displayed in tables from the Results tab of the Options dialog (accessed via Model |Options... from the main menu).
- You can copy the contents of a Time History Table to the clipboard by pressing Ctrl+C. You must first select the cells you wish to copy. You can do so by placing your cursor in one cell and dragging to another location. You can select the entire table by pressing the cell in the upper left-hand corner of the table. Cells that are not adjacent can be selected by pressing the Ctrl key when selecting. Selected items will be highlighted in black. You can subsequently paste the table into another application (such as a spreadsheet).
Note: When viewing time history results from a SubModel A specialized element that allows you embed one complete GoldSim model within another GoldSim model. This facilitates, among other things, probabilistic optimization, explicit separation of uncertainty from variability, and manipulation of Monte Carlo statistics. within the parent model, the Table display is modified somewhat, and in some cases provides slightly different options.
Learn more
- Viewing a Time History Chart
- Viewing Reporting Period-Based Results in Time History Result Elements
- Defining the Time Basis and Simulation Duration
- Viewing the Properties of a Time History Result
- Sorting Values in Result Tables
- Controlling Significant Figures and Scientific Notation in Result Displays
- Selecting Items and Copying Values in Result Tables
- Viewing SubModel Results in Time History Result Elements
- Controlling the Chart Style in Time History Results
- Disabling a Time History Result Element
- Exporting from a Time History Result Element to a Spreadsheet
- Exporting from a Time History Result Element to a Text File
- Using Result Classification and Screening in Time History Results
- Viewing a Time History Chart
- Viewing a Time History Table
- Viewing Reporting Period-Based Results in Time History Result Elements
- Viewing Scenario Results in Time History Result Elements
- Viewing SubModel Results in Time History Result Elements
- Viewing the Properties of a Time History Result
- Viewing Time Histories for Array Outputs
- Viewing Time Histories of Multiple Outputs
- Viewing Time Histories of Multiple Realizations
- Viewing Unscheduled Updates in Time History Result Elements