GoldSim's scenario A specific set of input data (and corresponding outputs) for a model. Multiple scenarios can be defined for a model. Different scenarios within a model are specifically differentiated by having different values for one or more Data elements. modeling capability allows you to directly compare results generated by different sets of input parameters. In effect, when you use this capability, your model can store (and subsequently compare) multiple sets of results (and inputs).
When a model is in Scenario Mode The state of a model when it contains scenario results, allowing multiple scenarios to be compared., Time History Result elements can be used to view scenario results.
In order for scenario results to be displayed in a Time History Result element, the Show button must be checked for each scenario to be displayed in the Scenario Manager A dialog that allows you to create, define and run scenarios. (accessed from the main menu (Run | Scenario Manager...) or by pressing F7):
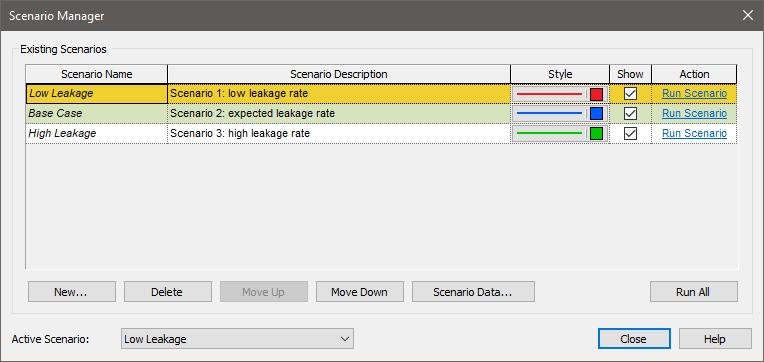
In this example, the Show box is checked for all three scenarios, so all three will be displayed in results.
If you double-click on a Time History Result element A Result element that shows the history of a particular output as a function of time. in Scenario Mode, GoldSim displays results for all scenarios for which scenario results have been generated (and for which the Show button has been checked from within the Scenario Manager).
Note that for each scenario, within the Scenario Manager you can edit the Style, as well as the Scenario Name. These affect how the results are labeled in chart and table displays.
The time history display for scenarios differs depending on how the simulation was run (single realization A single model run within a Monte Carlo simulation. It represents one possible path the system could follow through time. or multiple realizations), what you choose to display (e.g., a statistic or all realizations), and whether the Time History Result element contains multiple results.
In all cases, you can select which results and which scenarios you wish to display. For example, if only a single realization was run (for three different scenarios), the Table display in Scenario Mode would look like this:
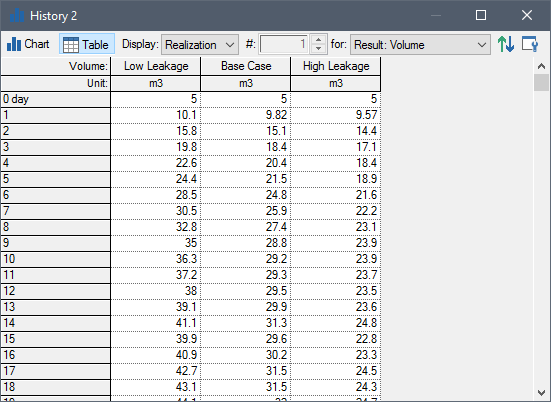
By default, all scenarios are displayed for the first result listed in the Properties dialog for the Result element. Each column then represents a scenario. The result being displayed is indicated in the upper left-hand corner of the table.
The corresponding chart in Scenario Mode would look like this:
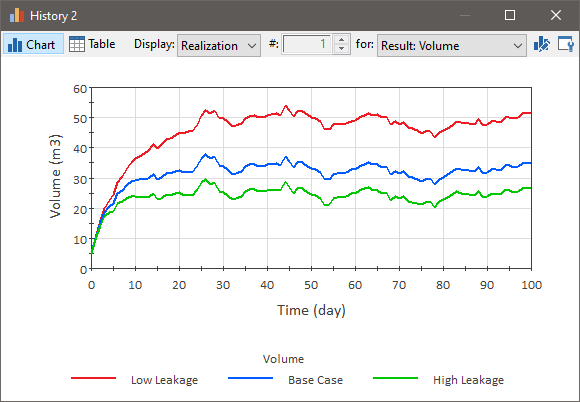
The Scenario Names are shown in the legend. The Result being displayed is indicated in the legend title.
You can specify exactly which scenarios and results you wish to display using a drop-list at the top of the display window. In the example below, there are two results and three scenarios:
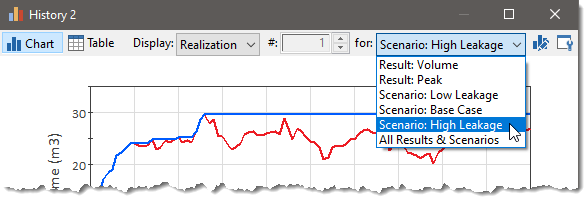
Selecting an option prefaced with "Result" displays all the scenarios for that particular result (as shown in the table and chart shown above). Selecting an option prefaced with "Scenario" displays all the results for that particular scenario (as illustrated below):
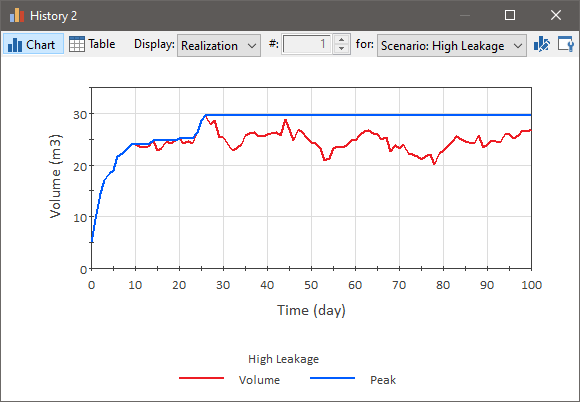
In this example, two different results are shown (Volume and Peak) for the selected scenario (High Leakage). The corresponding Table display would look like this:
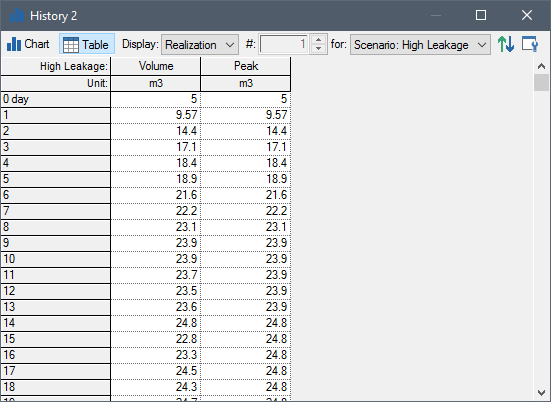
Each column represents a result. The scenario being displayed is indicated in the upper left-hand corner of the table.
There is also an option to display "All Results & Scenarios":
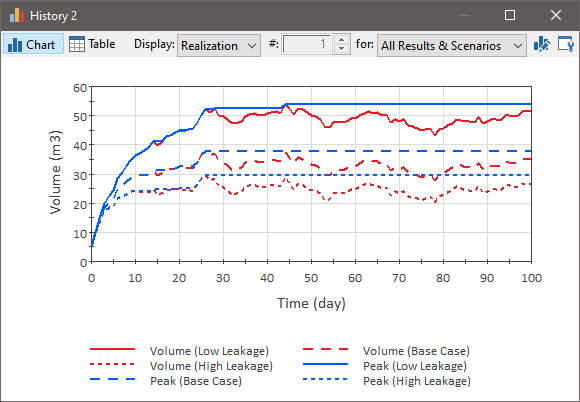
Note: Array A collection of variables that share common output attributes and can be manipulated in GoldSim elements or input expressions. results cannot be compared in Scenario Mode. Only scalar An output consisting of a single value or condition. results can be displayed. Hence, if an array is listed as one of the results in the Result Properties page, it will not be available for selection in the display dialogs when comparing scenarios (i.e., when the model is in Scenario Mode). If you wanted to compare one or more items from an array in Scenario Mode, you would need to add those scalar array items as separate results in the Result Properties dialog.
Note: Scenario results are only available for results that are added to the Result element before you run a scenario. If you add a result after you run a scenario, scenario results for that output will not be available for that scenario.
If you have run multiple realizations for the various scenarios, what is shown is a function of what has been selected from the Display list:
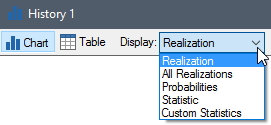
In particular, if Realization, Statistic or Custom Statistics is selected, GoldSim shows the selected result for each scenario:
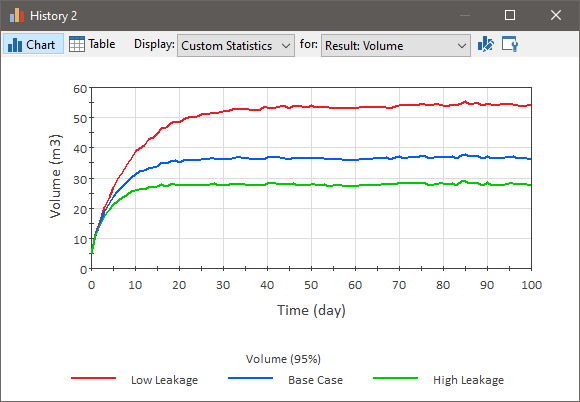
This is possible because in these three cases, there is only one set of results to display for each scenario (e.g., the selected statistic for each output).
However, if All Realizations or Probabilities is selected, only one scenario can be viewed at a time, and it is necessary to select which scenario (and output if multiple outputs are referenced by the Result element) you wish to view, since these two displays require multiple sets of results for each scenario (e.g., all realizations for a selected scenario and selected output):
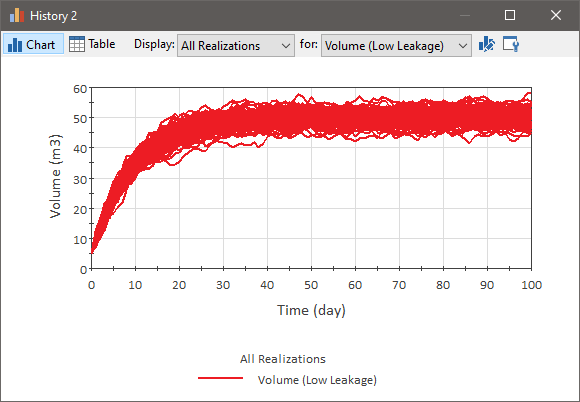
The result and scenario that is displayed is selected directly to the right of the Display list (after "for"). In the example above, the result named "Volume" for scenario "Low Leakage" has been selected.
When viewing a Time History result in Scenario Mode, if 1) you have defined more than one category (defined at the bottom of the Monte Carlo Result Display Properties dialog); and 2) you are displaying All Realizations for a multiple realization run, GoldSim will label the curves in the Time History Chart based on the categories you have defined. For example, if your categories were defined as "Normal", "Too Low" and "Danger", a chart with categories might look like this:
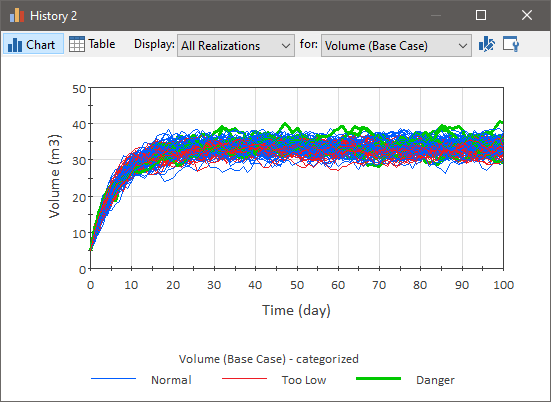
Note that the chart is displaying a single result for a single scenario.
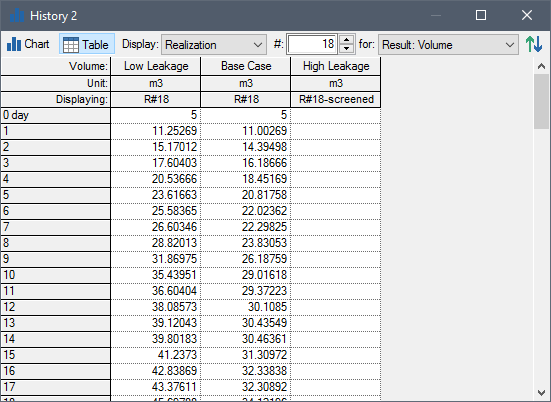
In addition, screening by category is active in Scenario Mode. That is, if you have chosen to screen out one or more categories (by clearing the Include box in the dialog above), the scenario results that are shown (in charts and tables) only include those realizations in the categories which you have chosen to include.
Note that depending on how you have defined the categories, it is possible for a realization to fall into a different category in different scenarios. Hence, when screening results in Scenario Mode, the number of realizations within each scenario may differ. In the example below (displayed as a table), realization #18 is included in the first two scenarios, but is screened from the third:
Note: High resolution results (unscheduled updates Timesteps that are inserted automatically by GoldSim during a simulation and are not directly specified by the user prior to running the model.) are never displayed in Scenario Mode. They are only available in Result Mode The state of a model when it has been run and contains simulation results for a single set of input parameters.. Hence, you cannot view high resolution results when comparing scenario results. When comparing scenarios, only scheduled updates are included in displays.
Note: Scenario results are not saved for time history results associated with a SubModel A specialized element that allows you embed one complete GoldSim model within another GoldSim model. This facilitates, among other things, probabilistic optimization, explicit separation of uncertainty from variability, and manipulation of Monte Carlo statistics.. If a Result element in a parent model is linked to SubModel time history results, no results will be displayed in Scenario Mode.
Learn more
- Controlling the Chart Style in Time History Results
- Disabling a Time History Result Element
- Exporting from a Time History Result Element to a Spreadsheet
- Exporting from a Time History Result Element to a Text File
- Using Result Classification and Screening in Time History Results
- Viewing a Time History Chart
- Viewing a Time History Table
- Viewing Reporting Period-Based Results in Time History Result Elements
- Viewing Scenario Results in Time History Result Elements
- Viewing SubModel Results in Time History Result Elements
- Viewing the Properties of a Time History Result
- Viewing Time Histories for Array Outputs
- Viewing Time Histories of Multiple Outputs
- Viewing Time Histories of Multiple Realizations
- Viewing Unscheduled Updates in Time History Result Elements