When you wish to view time history results for an array A collection of variables that share common output attributes and can be manipulated in GoldSim elements or input expressions. output, you must first choose whether you wish to view results for a single item of the array, for selected items, or for all items.
If you wish to view results for only a single item, you should expand the array in the browser An alternative view of a GoldSim model, in which elements are displayed in a tree, and organized either hierarchically, or by type. or output interface, right-click on the specific item which you wish to view, and select Time History Result... from the context menu.
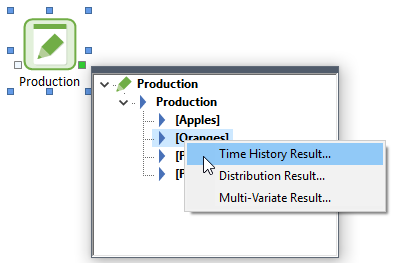
Alternatively, you could do the same thing in the Result Properties dialog (i.e., select a single item) when adding the output to the list.
Note: When you create a new array element, the Time History checkbox defaults off (and hence time histories are not saved). If you wish to save time histories for an array, you must specifically check this box (or reference the output in a Time History Result element A Result element that shows the history of a particular output as a function of time.).
If, however, you wish to view selected items (or all items) of the array, you should either right-click on the entire array, and select Time History Result... from the context menu, or add the entire array to the list in the Result Properties dialog. If you do so, the Result Properties dialog looks like this:
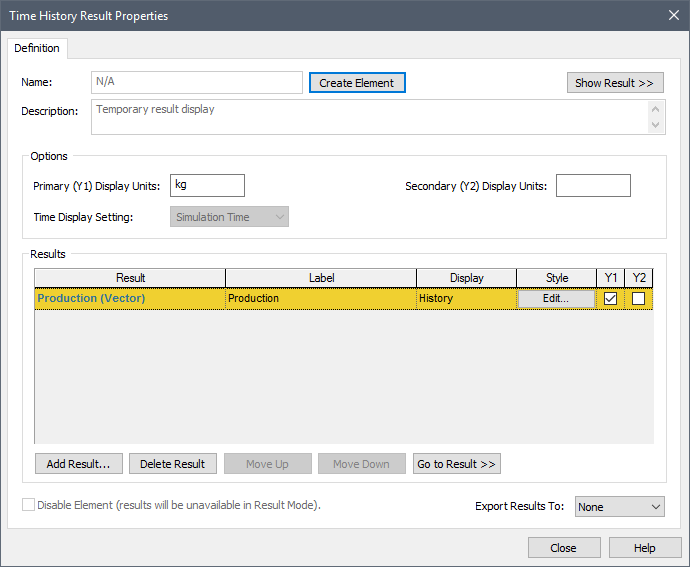
Note that in the Result column, the type of array (in this case, a vector A one-dimensional array.) is specified.
In addition, the Style column includes an Edit... button for each array result. This button can be used to specify the Style for each item being plotted (e.g., line color), and can also be used to specify which items will be included in the display.
Pressing the Edit... button for a vector result displays an option to edit the Array Label set defining the vector:
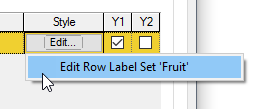
In this example, selecting this option would display the "Fruit" Array Label Set:
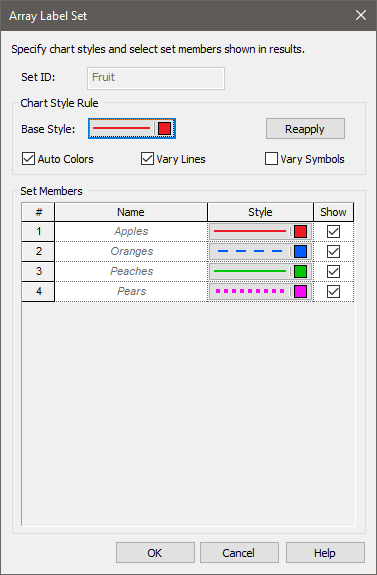
This dialog allows you to change the Style for each item used for charts. In addition, the Show checkbox allows you to select which items are included in the displays (by default all will be checked).
If you choose to display a time history chart of an entire vector, the chart will look something like this.
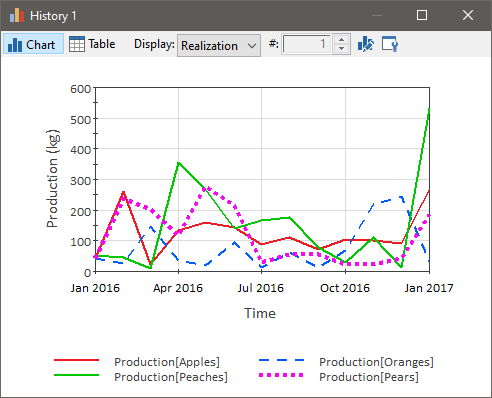
GoldSim will display each item of the vector, and add a legend. The style of each line is defined by the Style in the Array Label Set dialog, and the legend lists the array item names.
Note: If you do not want to repeat the name of the array (Production in the example shown above), you can specify a blank Label for that result item in the Properties dialog.
The table view of a vector would look like this:
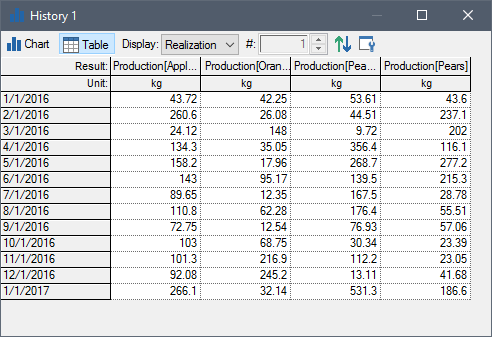
Each item of the vector is displayed in a different column.
Pressing the Edit... button for a matrix A two-dimensional array. result displays an option to edit both the row and the column Array Label sets defining the matrix:
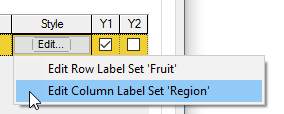
This allows you to select specific rows or columns to include/exclude in the displays, and also allows you to define the Style for each item in charts.
When displaying charts and tables for a matrix, GoldSim, by default, displays all items. For example, the chart below displays a matrix with 4 rows and 2 columns:
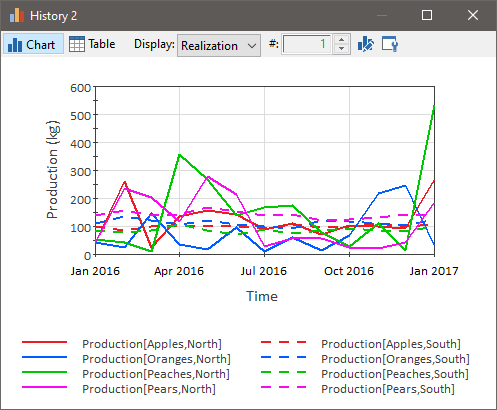
In such a chart, how are the Styles determined, since each row and each column has a specified Style (defined in the Array Label Set dialog) and each item being plotted is associated with both a row and a column? When plotting a matrix, the following rules are applied for each item:
- The color for an item is based on the Style for the row; and
- All other attributes, such as the line width, style (e.g., solid, dashed), symbol style, symbol size and symbol color, are based on the Style for the column.
The table view of a matrix looks like this:
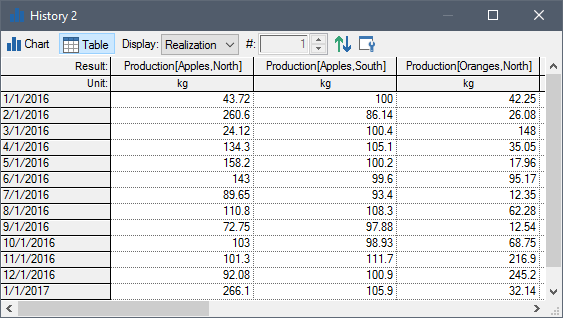
Each item of the matrix (which has been selected to be shown in the Array Label Set dialogs) is displayed in a different column of the table.
When you are viewing time histories of multiple realizations of an array, the display windows provide a number of options that allow you to select how you want to view the results. Some options allow you to view probabilistic results for one item at a time (e.g., all realizations for a single result), while others allow you to view probabilistic results for all items simultaneously (e.g., a particular statistic for each result).
Learn more
- Controlling the Chart Style in Time History Results
- Disabling a Time History Result Element
- Exporting from a Time History Result Element to a Spreadsheet
- Exporting from a Time History Result Element to a Text File
- Using Result Classification and Screening in Time History Results
- Viewing a Time History Chart
- Viewing a Time History Table
- Viewing Reporting Period-Based Results in Time History Result Elements
- Viewing Scenario Results in Time History Result Elements
- Viewing SubModel Results in Time History Result Elements
- Viewing the Properties of a Time History Result
- Viewing Time Histories for Array Outputs
- Viewing Time Histories of Multiple Outputs
- Viewing Time Histories of Multiple Realizations
- Viewing Unscheduled Updates in Time History Result Elements