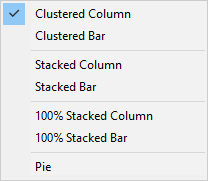
Final Value results can be viewed as a table, or as one of several different charts (bar, column, stacked bar, stacked column, or pie).
In particular, seven different charts can be displayed:

Depending on the type of run and collection of outputs that you have specified for comparison in a Final Value result, there are typically from one to three "dimensions" which you can select from in order to create the display (for array displays, there can be four). These "dimensions" can be defined by:
- The output(s);
- Realization A single model run within a Monte Carlo simulation. It represents one possible path the system could follow through time.(s) or statistic(s) generated from those realizations;
- Scenario A specific set of input data (and corresponding outputs) for a model. Multiple scenarios can be defined for a model. Different scenarios within a model are specifically differentiated by having different values for one or more Data elements.(s);
- Capture Time(s); and
- Result items in an array A collection of variables that share common output attributes and can be manipulated in GoldSim elements or input expressions. row or column of a vector A one-dimensional array. or matrix A two-dimensional array. output.
In the
Learn more
- Displaying Multiple Outputs in Final Value Results
- Displaying Multiple Realizations in Final Value Results
- Viewing Scenario Results in Final Value Result Elements
- Displaying Capture Times in Final Value Results
- Displaying Final Value Results for Vectors
- Displaying Final Value Results for Matrices
- Displaying Final Value Results for Negative Numbers