As their name indicates, Final Value results operate on Final Values. That is, they allow you to view and compare values at the end of each realization A single model run within a Monte Carlo simulation. It represents one possible path the system could follow through time..
In some cases, however, you may also want to view and compare results at other times in the simulation (rather than just the end of the simulation). This can be useful, for example, if you wanted to compare the value of different outputs at several different "snapshots" in time during a simulation. GoldSim facilitates this by allowing you to create Capture Times User-defined points in time during a simulation at which “Final Value” results are captured for result display. The final time point in the simulation is always included as a Capture Time, but additional times can be added. at which these results are also made available. In particular, Final Value Result elements allow the Capture Time to be specified as one of the "dimensions".
Note: Capture Times cannot be viewed in Scenario Mode The state of a model when it contains scenario results, allowing multiple scenarios to be compared. (i.e., only the Final Result can be viewed). That is, if you are running scenarios and viewing results using Final Value Result elements you cannot view results for scenarios at specified Capture Times. You can only view scenario A specific set of input data (and corresponding outputs) for a model. Multiple scenarios can be defined for a model. Different scenarios within a model are specifically differentiated by having different values for one or more Data elements. results for the Final Result.
When you are viewing a Final Value result in a model in which you have defined Capture Times, when viewing a table you will be able to select "All Capture Times" (or a single Capture Time) for the Rows, Columns or Layer. When viewing a chart you will be able to select "All Capture Times" (or a single Capture Time) for the Series or Points, or select a single Capture Time for the Layer. This provides a great deal of flexibility for displaying Capture Time results.
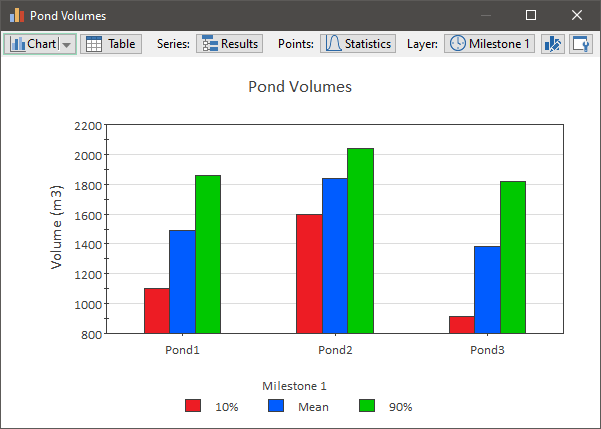
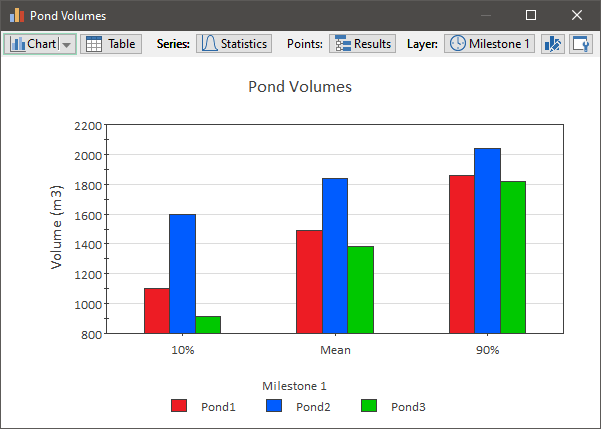
For example, if you were viewing multiple outputs and multiple realizations, you could choose to display a chart showing all outputs and all statistics for a particular Capture Time (in two different ways):
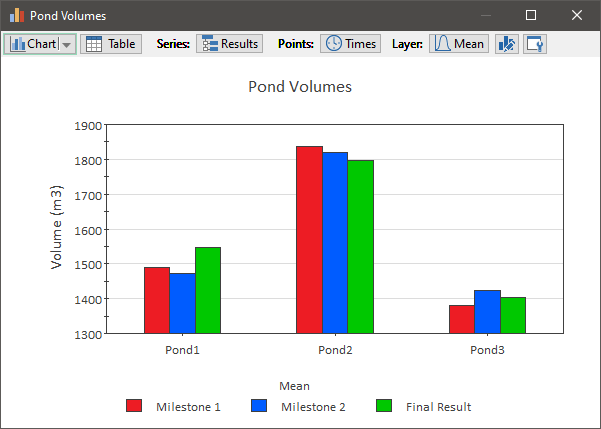
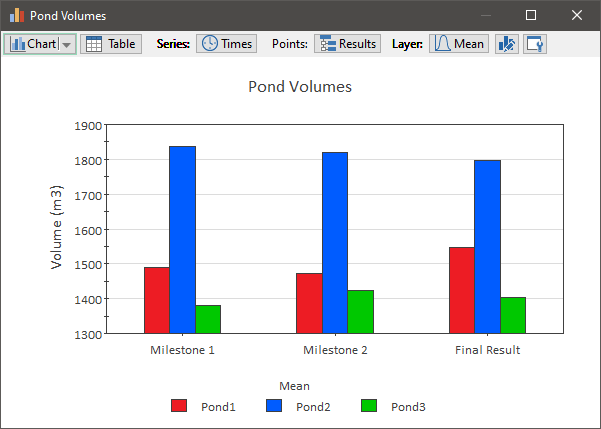
Alternatively, we could choose to display a chart showing all outputs and all Capture Times for a particular statistic (in two different ways):
Finally, you could choose to display a column chart showing all Capture Times and all statistics for a particular output (in two different ways):
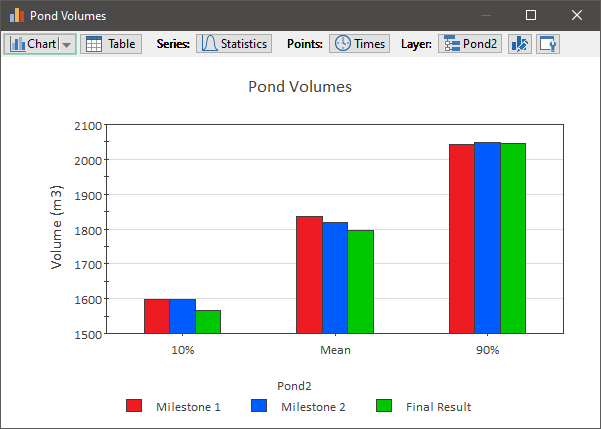
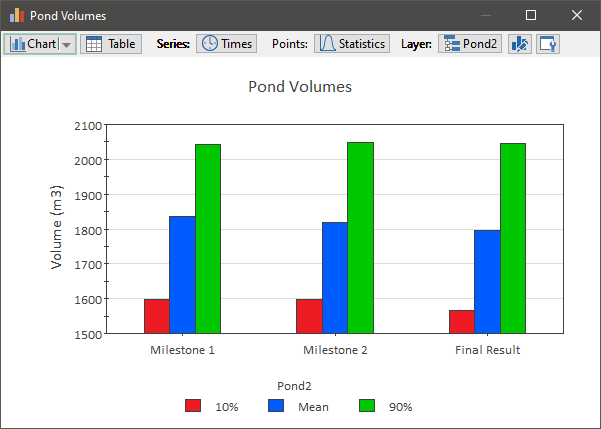
Of course, we could also display other types of charts (bar charts, stacked bar or column charts, or pie charts).
Learn more
- Displaying Capture Times in Final Value Results
- Displaying Final Value Results for Matrices
- Displaying Final Value Results for Negative Numbers
- Displaying Final Value Results for Vectors
- Displaying Multiple Outputs in Final Value Results
- Displaying Multiple Realizations in Final Value Results
- Viewing Scenario Results in Final Value Result Elements