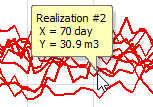
GoldSim allows you to view a "data tip" by holding the cursor over a data point in a chart. The example below shows a data tip for a point in a time history chart:

In this particular case, the data tip displays the realization A single model run within a Monte Carlo simulation. It represents one possible path the system could follow through time. number for the curve, and X and Y values of the data point. (For a time history chart, the X axis is always time).
Related topics…
- Controlling Significant Figures and Scientific Notation in Result Displays
- Selecting Items and Copying Values in Result Tables
- Size of Values Displayed
- Sorting Values in Result Tables
- Using Context Menus in Charts
- Viewing and Editing Result Properties
- Viewing Data Tips in Charts
- Viewing Results at Capture Times
- Zooming in on a Chart