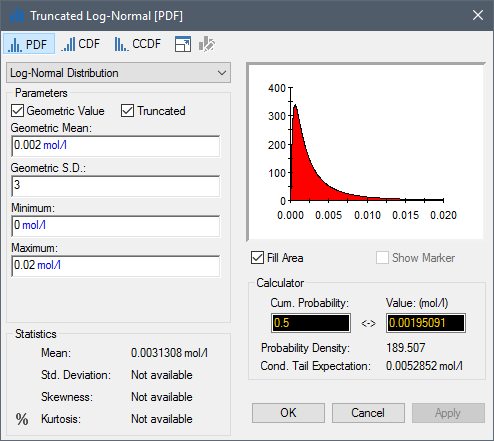
The Log-Normal distribution is used to describe quantities in which the logarithm of the value is normally distributed. The Log-Normal is typically used to represent physical quantities which must be non-negative and are positively skewed. This distribution is often used to represent quantities with large (order-of-magnitude) uncertainties.
Log-Normal distributions can be entered in two ways: 1) by entering the Geometric Mean and the Geometric S.D.; or 2) by entering the True Mean and the True S.D. If Geometric Value is checked, the former method is used. When one option is chosen, the other set of parameters are computed internally by GoldSim and are grayed out.
With regard to a set of data points, the Geometric Mean is equal to the exponentiated mean of the logs (i.e., 10X, where X is equal to the mean value of the logarithms of the data points). With regard to a set of data points, the Geometric S.D. is the exponentiated standard deviation The square root of the variance of a distribution. The variance is the second moment of the distribution and reflects the amount of spread or dispersion in the distribution. of the logs (i.e., 10Y, where Y is equal to the standard deviation of the logarithms of the data points). Note that the Geometric S.D. is always dimensionless, and must be greater than 1.
The True Mean and the True S.D. refer to the true (arithmetic) mean and S.D. (i.e., in linear space).
A Log-Normal distribution can be Truncated. Note that in this case, the inputs (i.e., Mean and Standard Deviation) refer to the statistics prior to truncation.
All inputs for a Log-Normal must be positive values.

- Beta Distribution
- BetaPERT Distribution
- Binomial Distribution
- Boolean Distribution
- Cumulative Distribution
- Discrete Distribution
- Exponential Distribution
- Externally-Defined Distribution
- Extreme Probability Distribution
- Extreme Value Distribution
- Gamma Distribution
- Generalized Beta Distribution
- Log-Normal Distribution
- Negative Binomial Distribution
- Normal Distribution
- Pareto Distribution
- Pearson Type III Distribution
- Poisson Distribution
- Sampled Results Distribution
- Student’s t Distribution
- Triangular Distribution
- Uniform Distribution
- Weibull Distribution