Once a model is in Scenario Mode The state of a model when it contains scenario results, allowing multiple scenarios to be compared., if you were to browse the model, you would note the following:
- If you browse to a Scenario Data Data elements that differentiate the various scenarios in a model. element, it will display the value for the Active Scenario When scenarios have been defined, the scenario that is being viewed when you are browsing a model..
- There is no option to right-click on an element and view its results. Elements do not store results in Scenario Mode.
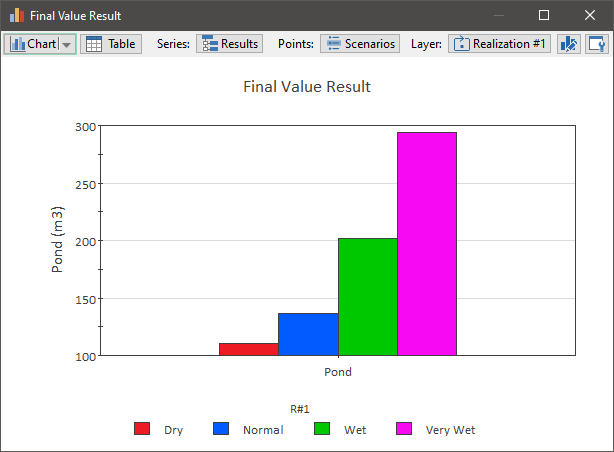
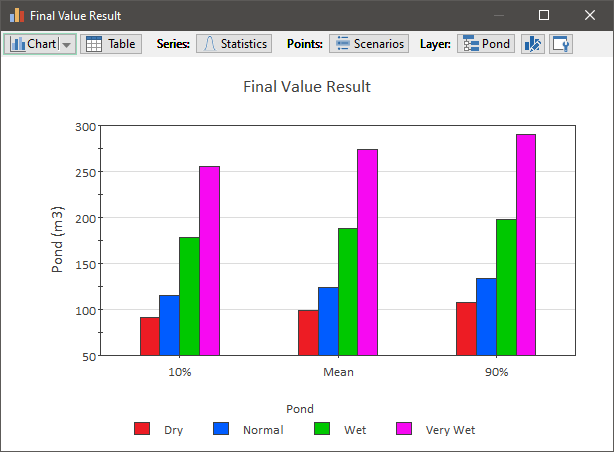
- If you double-click on a Final Value Result element A Result element that allowz you to compare results in the form of bar charts, column charts, pie charts and tables., what is displayed is a function of how the Result element is configured. It could display results for all scenarios for which scenario A specific set of input data (and corresponding outputs) for a model. Multiple scenarios can be defined for a model. Different scenarios within a model are specifically differentiated by having different values for one or more Data elements. results have been generated (and the Show button has been checked) or for only the Active Scenario.
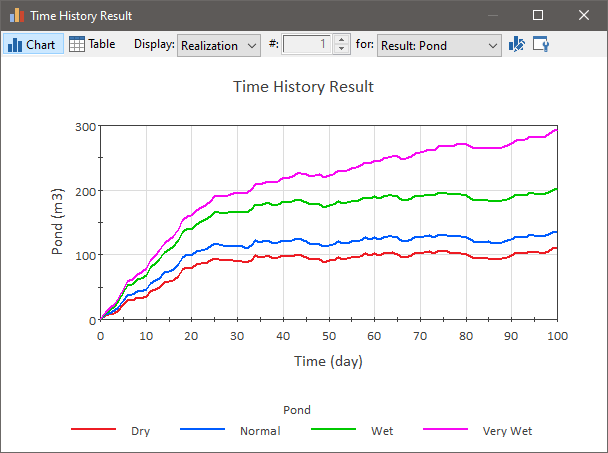
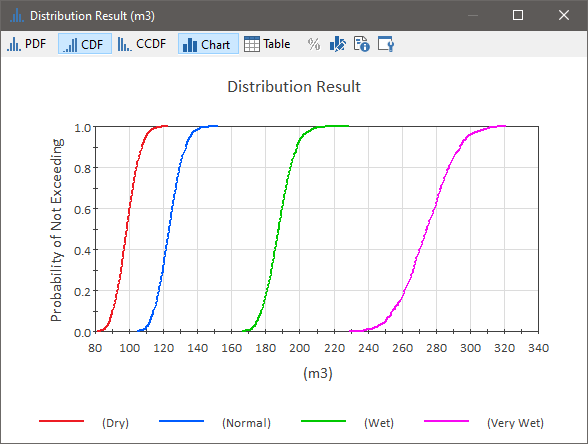
- If you double-click on a Time History Result element A Result element that shows the history of a particular output as a function of time. or a Distribution Result element A Result element that provides a way to view the final values of probabilistic outputs., GoldSim displays results for all scenarios for which scenario results have been generated (and the Show button has been checked).
For example, a Time History Result would look like this:

One of the possible displays for a Final Value Result would look like this:

Each scenario is shown and indicated in the legend.
If the simulation is probabilistic, a Distribution Result will look like this, displaying the probability distribution A mathematical representation of the relative likelihood of a variable having certain specific values. It can be expressed as a PDF (or a PMF for discrete variables), CDF or CCDF. for each scenario:

One of the possible displays for a Final Value Result for a probabilistic simulation allows you to view various statistics for each scenario and would look like this:

Note: Only Time History, Distribution and Final Value Result elements display scenario results. Scenario results cannot be displayed for other types of Result elements.
If you press F4 you can return to Edit Mode The state of a model when it is being edited and does not contain simulation results. (by deleting all scenario results), or you can choose to only delete the scenario results for the Active Scenario (while keeping the others). In this latter case, you will remain in Scenario Mode.
Pressing F5 will run the Active Scenario and place
the model in Result Mode The state of a model when it has been run and contains simulation results for a single set of input parameters.. As discussed
Note: All scenario results are deleted when you return to Edit Mode. However, any scenario results that exist prior to entering Result Mode are retained in Result Mode (and can be viewed again if you return to Scenario Mode).
Learn more
- Comparing Scenario Results in Scenario Mode
- Exporting Scenario Results from a Time History Result Element to a Spreadsheet
- Generating and Deleting Scenario Results Using the Scenario Manager
- Transitioning Directly from Result Mode to Scenario Mode
- Understanding the Difference Between Result Mode and Scenario Mode
- Viewing Detailed Scenario Outputs in Result Mode
- Viewing Scenario Results in Distribution Result Elements
- Viewing Scenario Results in Time History Result Elements
- Viewing Scenario Results