The Edit... button on the Stochastic dialog accesses a dialog for specifying the probability distribution defining the element.
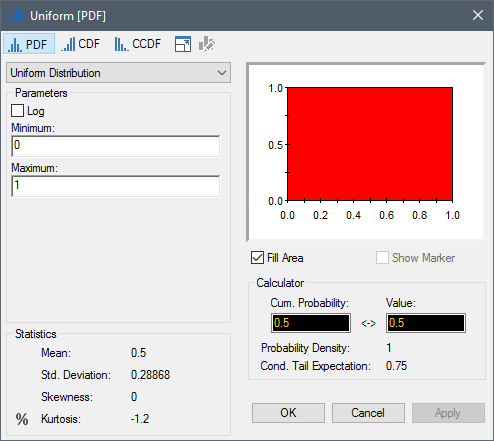
The drop-list in the upper left-hand corner of the dialog contains a list of all of the distributions provided by GoldSim.
Directly below this field, you enter the parameters defining the selected distribution (the parameters differ depending on the distribution type). These can be constants, links or expressions.
A preview of the distribution chart is displayed in the upper right-hand corner of the dialog. Note that after edited the distribution parameters, you must press Apply to update the chart.
The statistics for the distribution
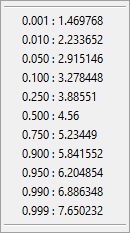
The Percentile button (which looks like this: %) displays the percentiles of the distribution:
The Calculator section of the dialog allows you to compute the value associated with a particular percentile or the percentile associated with a particular value:
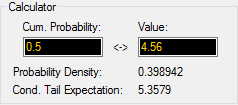
The Calculator also displays the Probability Density and the Conditional Tail Expectation for the specified Cumulative Probability/Value pair. The Conditional Tail Expectation is the expected value of the output given that it lies above a specified Cumulative Probability. That is, it represents the mean of the worst 100(1 - α)% of outcomes, where α is the specified Cumulative Probability.
Note: Calculation of the Conditional Tail Expectation is discussed in detail in Appendix B of the GoldSim User’s Guide.
The toolbar at the top of the dialog is used to control the distribution plot. The functions of the various buttons are as follows:
| Button | Action |

|
Display the preview as a PDF
(probability density function A function whose Y-axis can be interpreted as providing the relative likelihood that the value of a random variable would be equal to value specified on the X-axis. Hence, the dimensions of the Y-axis are the inverse of those of the X-axis (i.e., the probability per unit length of the X-axis).):
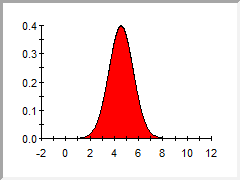 Note that if Fill Area is checked below the preview, the area below the PDF line is filled in (this applies to CDF and CCDF previews also). |

|
Display the preview as a CDF
(cumulative distribution function The integral of a probability density function.):
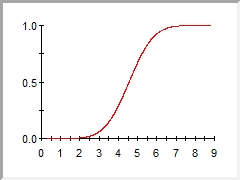 Note that for a CDF Cumulative Distribution Function. The integral of a probability density function., if Show Marker is checked below the preview, the particular value/percentile entered in the Calculator section is indicated on the plot. |

|
Display the preview as a CCDF
(complementary cumulative distribution function The complement of the cumulative distribution function (which is the The integral of a probability density function).):
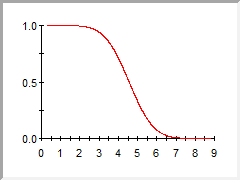 |

|
Display a full chart of the distribution. (You can also display the full chart by double-clicking on the preview or pressing Ctrl+Shift+T). (When viewing the full chart, pressing the button again returns to the Distribution dialog.) A full chart can be customized to a much greater degree than a preview chart (e.g., you can add headers and footers; axis labels, etc.). |
Note: You can toggle through the three types of distribution displays (PDF, CDF, CCDF) using the PgUp and PgDn keys.
- Applying Importance Sampling to a Stochastic Element
- Browser View of a Stochastic Element
- Controlling When a Stochastic Element is Sampled
- Correlating Stochastic Elements
- Creating a Stochastic Vector
- Customized Importance Sampling Using User-Defined Realization Weights
- Dynamically Revising Distributions Using Simulated Bayesian Updating
- Specialized Functions That Operate on Distributions
- Specifying a Deterministic Value for a Stochastic
- Specifying the Distribution for a Stochastic Element
- Stochastic Distribution Types
- Triggering a Stochastic