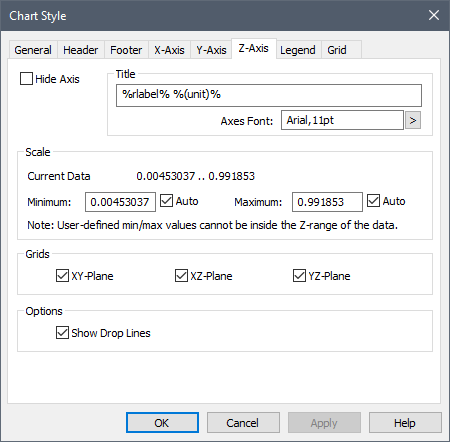
The Z-axis tab of the Chart Style dialog box is only available when viewing 3D scatter plots and 3D array A collection of variables that share common output attributes and can be manipulated in GoldSim elements or input expressions. plots and contains a subset of the options available on the other axes.

This is because the nature of a 3D plot is such that other than the title, the scale, the font and the font size, the appearance of the axis labels in a 3D plot are fixed by GoldSim and cannot be edited.
The various fields in this tab are described below:
Title: This is the axis title. If you right-click within the Title edit field, a context menu providing a list of keywords Text delimited by the % symbol (e.g., %x_unit%) that can be used when creating chart styles to insert context sensitive text (e.g., for axis labels). will be provided. Keywords allow you to automatically insert text that is determined automatically by the context of the result (e.g., the keywords %rlabel% %(unit)% inserts the result label and the display units The units (e.g., m, g, $/day) in which an output is displayed within GoldSim. for the output associate with the axis). This allows you to use a single chart style A collection of settings for a particular type of result display chart. for multiple results.
Axis Font: This provides access to a dialog for specifying the font for the axis. Note that this font is applied to all axes (i.e., all axes must use the same font).
Hide Axis: If this box is checked the entire axis (and all annotation) is hidden.
Scale Minimum: This is the minimum value (lower bound) on the axis. If Default is checked, GoldSim will select the value for you (based on the range).
Scale Maximum: This is the maximum value (upper bound) on the axis. If Default is checked, GoldSim will select the value for you (based on the range).
Grids (XY-Plane, XZ-Plane, YZ-Plane): This determines if grids are shown for the specified planes. If checked (and applicable to the plot), the grids are shown.
Show Drop Lines: If this box is checked, GoldSim will draw a line from the data point to the XY-plane for scatter plots. It does not apply to array charts.