You can use the Spreadsheet element An element that can dynamically link to an Excel spreadsheet. to import a probability distribution A mathematical representation of the relative likelihood of a variable having certain specific values. It can be expressed as a PDF (or a PMF for discrete variables), CDF or CCDF. from a spreadsheet. The distribution is defined in the spreadsheet using a number of fields that specify the type of distribution, as well as the arguments to the distribution.
Probability distributions must be specified in the
spreadsheet in a very specific format. In particular, the distribution
must be defined in a row of adjacent cells in the spreadsheet. The first
cell is a code that defines the type of distribution. The subsequent cells
(to the right of the code) define the input parameters for the
distribution. The table below specifies how each type of distribution must
be entered in the spreadsheet.
| Distribution | Type Code | Distribution Parameters | ||||
| Cell1 | Cell2 | Cell3 | Cell4 | Cell5 | Cell6 | |
| Generalized Beta | BETAGEN | Mean | SD | Min | Max | |
| Beta | BETASF | Successes | Failures | |||
| BetaPERT | BETAPERT | Min (0%) or 10% | Most Likely | Max (100%) or 90% | 0 for 0/100; 1 for 10/90 | |
| Binomial | BINOM | Batch Size | Prob | |||
| Cumulative | CUM | # pairs | Linear = 0; Log = 1 | Prob1 | Val1 | |
| Discrete | DISCRETE | # pairs | Prob1 | Val1 | Prob2 | Val2 |
| Exponential | EXPON | Mean | ||||
| Extreme Probability | EXTRPROB | Min = 0; Max =1 | Number samples | |||
| Extreme Value | EXTRVAL | Min = 0; Max =1 | Location | Scale | ||
| Gamma | GAMMA | Mean | SD | (Min) | (Max) | |
| Log-Normal | LOGNORM | True = 0; Geom = 1 | True or Geom Mean | True or Geom SD | (Min) | (Max) |
| Negative Binomial | NEGBINOM | Number successes | Prob of success | |||
| Normal | NORMAL | Mean | SD | (Min) | (Max) | |
| Pareto | PARETO | Shape | Mode | (Max) | ||
| Pearson Type III | PEARSON | Location | Scale | Shape | ||
| Poisson | POISSON | Expected Value | ||||
| Sampled Results | SAMPLED | # Results | Val1 | Val2 | Val3 | Val4 |
| Student's t | STUDENTT | Deg of Freedom | ||||
| Triangular | TRIANG | Linear =0; Log =1 | Min (0%) or 10% | Most Likely | Max (100%) or 90% | 0 for 0/100; 1 for 10/90 |
| Uniform | UNIFORM | Linear =0; Log =1 | Min | Max | ||
| Weibull | WEIBULL | Min | Slope | Mean - Min | (Max) | |
Sampled Results can have as many Values as required.
Parameters in parentheses are optional.
If Log-Normal distribution is defined using Geometric parameters, the SD is dimensionless.
Bold parameters are dimensionless; others have same dimension as the distribution.
There is no option to import a Boolean distribution.
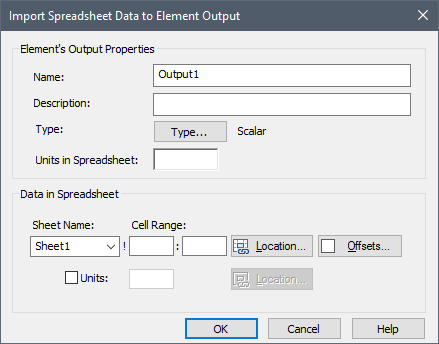
To import a distribution from a spreadsheet, you must press the Type button in the Import dialog:

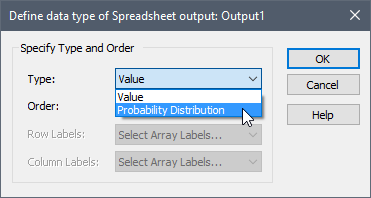
After doing so, the following dialog will be displayed. You must select "Probability Distribution" as the Type:

The Order of a Probability Distribution must be Scalar An output consisting of a single value or condition..
When you specify the Location, you must select a single cell: that corresponding to the Type Code for the distribution. GoldSim will automatically read in the appropriate number of additional cells based on the distribution type.
Note: Prior to running the model, you can view any spreadsheet data that you plan to import by first selecting the Update Spreadsheet Outputs item in the menu displayed via the Options>> button for the Spreadsheet element, and then viewing the outputs of the element in tool-tips within the element's output port.
Note: Care must be taken when importing distributions that represent dates and temperatures. This is because dates and temperatures both have an absolute reference (i.e., 12/31/1899 for dates and absolute zero for temperatures). Differences between dates are expressed in units of time (e.g. days, seconds, etc) and differences between temperatures are expressed in “deg” units (Cdeg, Fdeg). This can lead to errors when importing Stochastics, since GoldSim assumes a single unit for the distribution parameters, while some types of distributions would require two different types of units. For example, a Normal distribution representing a temperature would require the Mean to be specified in absolute units (e.g., C) and the Standard Deviation The square root of the variance of a distribution. The variance is the second moment of the distribution and reflects the amount of spread or dispersion in the distribution. to be specified in difference units (e.g., Cdeg). Similarly, a Normal distribution representing a date would require the Mean to be specified in absolute units (e.g., as a date) and the Standard Deviation to be specified in difference units (e.g., days). If faced with this problem, there are several approaches for addressing this: 1) Use a distribution type where all parameters have the same units (e.g., triangular, uniform, cumulative); or 2) Specify and import the distributions as dimensionless and then apply a unit to the sampled value using an Expression element A function element that produces a single output by calculating user-specified mathematical expressions.. This latter option would work for temperatures, but not dates, since a date cannot be specified with dimensionless values. It could, however, be imported as a Julian date, in which case you could use day units (or some other time unit). Alternatively, the mean date could be defined as a Data element An input element intended to represent constant inputs in a model. and an imported distribution with time units could be used to model a “lag” (positive or negative) from the fixed date. An Expression element could be used to add the sampled lag value to the fixed (mean) date.
When a distribution is imported in this way, the output type on the spreadsheet element is not a value; rather, it is a complex output referred to as a Distribution output. Distribution outputs are complex outputs that represent all the statistical information necessary to define a probability distribution and only be used in several specialized locations.
To import this information into a Stochastic element An element that can be used to quantitatively represent the uncertainty in a model input., you must then use this Distribution output as the definition for a Stochastic element specified as an Externally-Defined distribution.
- Controlling When GoldSim Exchanges Data with the Spreadsheet File
- Defining Offsets for Inputs and Outputs to a Spreadsheet Element
- Defining the Properties of a Spreadsheet Element
- Exchanging Date Information with a Spreadsheet
- How Spreadsheet Files are Affected By GoldSim
- Importing Stochastic Element Definitions from a Spreadsheet
- Locking onto a Spreadsheet File
- Saving Spreadsheet Element Outputs
- Shifting Ranges for Inputs and Outputs to a Spreadsheet Element
- Spreadsheet Element Inputs - Exporting Data to the Spreadsheet
- Spreadsheet Element Outputs - Importing Data from the Spreadsheet
- Using the Spreadsheet Wizard to Define Spreadsheet Inputs
- Using the Spreadsheet Wizard to Define Spreadsheet Outputs
- Viewing a Spreadsheet Element in the Browser