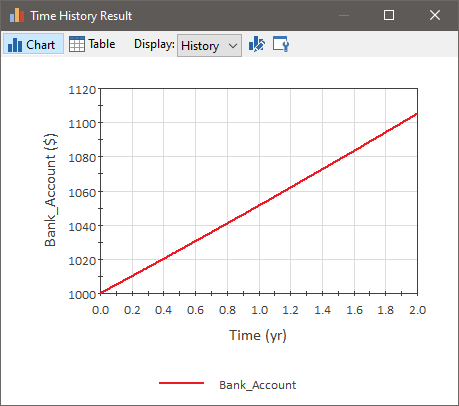
We can now run the model by pressing F5. After the simulation completes, right-click on the Bank_Account element and then left-click on Time History Result... in the context menu to view a time history plot of the result:

What are we looking at here? This is actually a plot of the amount of money in the bank account as a function of time. It starts with an initial value of $1000, and increases to just over $1100 after 2 years. The line appears to be linear, but it is actually the early portion of an exponential curve. If the interest rate was significantly higher, or the simulation was longer, the curve would be more obviously exponential.
Before thinking about this result plot further, it's important to first discuss how GoldSim moves the simulation through time. GoldSim "updates" the model as follows:
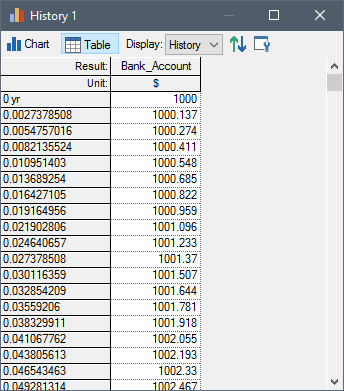
- The model is updated (all the elements in the model are recalculated) at the timesteps specified by the user. In this case, this means that element values are recalculated at 0 day, 1 day, 2 day, ..., 730 days. Values for time history plots are recorded at these user specified timesteps.
- You can see the
actual values used to create the plot by viewing a table of the time
history. To do this, press Table button at the top of the time
history chart display. The following will then be displayed:

- GoldSim also updates the model upon the occurrence of certain kinds of "events". We currently don't have any such events in our model, but will add some later (in particular, some deposits and withdrawals). Events such as these could happen in the middle of a timestep A discrete interval of time used in dynamic simulations. (e.g., at 3.5 days). In this case, GoldSim would actually insert a new timestep at the point the event occurred (although this point would not be visible in the saved result histories).
- Step 1: Setting Up a Dynamic Financial Model
- Step 2: Adding a Fund Element to Simulate a Bank Account
- Step 3: Running the Model and Viewing a Simple Result
- Step 4: Adding Discrete Deposits to the Account
- Step 5: Running the Model with Deposits
- Step 6: Removing Discrete Withdrawals from the Account
- Step 7: Running the Model with Deposits and Withdrawals
- Step 8: Running Multiple Realizations of a Financial Model
- Where Do I Go From Here?