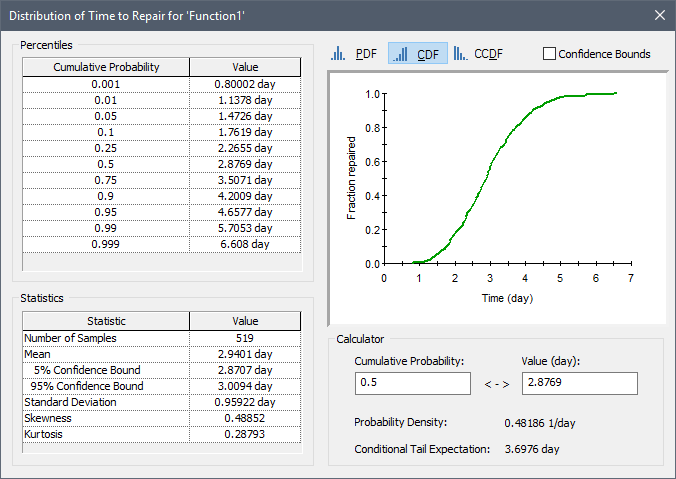
The Repair Times button in the Results tab of a reliability element allows you to view a distribution of the time to repair for the component:

Note: This dialog is nearly identical to the Distribution Summary for a standard Distribution result.
Note: The Display button for Repair Times is grayed out when the model is in Scenario Mode The state of a model when it contains scenario results, allowing multiple scenarios to be compared.. That is, you cannot view these results when running and comparing scenarios.
The Mean that is displayed represents the Mean Time to Repair (MTTR) for the component.
The times to repair represent the time intervals between when the component fails and when it is repaired and starts operating again. Of course, a single realization A single model run within a Monte Carlo simulation. It represents one possible path the system could follow through time. of the system can have multiple repairs. The distribution that is displayed incorporates all repairs for all realizations.
Learn more
Related topics…
- Availability and Reliability Histories and Statistics
- Availability and Reliability Results Summary
- Causal Analysis
- Defining and Using the Output Interface for a Reliability Element
- Exporting Availability and Reliability Summary Results
- Failure Times Statistics
- Reliability Element Status and Failure Mode Histories and Statistics
- Repair Times Statistics
- Saving and Accessing Reliability Results