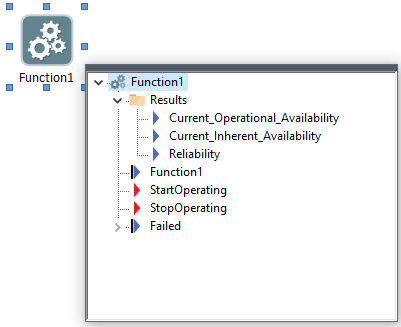
Within the output port for a reliability element there are three outputs provided in a folder named Results:

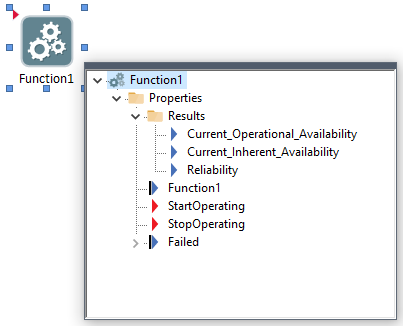
Note that if the element is being modeled as a system with child elements, these outputs are contained within a "Properties" folder when viewing the output port for the element:

Current_Operational Availability The probability that a component will be operating at any given time.: This is the fraction of time the element was operating over a specified time period immediately previous to the current time. The specified time period is approximately 2% of the simulation duration.
Current_Inherent Availability The probability that a component or system is performing its required function at any given time.: This is the fraction of time the element was operable over a specified time period immediately previous to the current time. A component that is turned off or has unmet external requirements, but has not failed would be considered operable. Hence, the Inherent Availability The probability that the component will be operable at any given time (a component that is turned off or has unmet external requirements, but is not failed is considered to be operable). is always greater than or equal to the Operational Availability. The specified time period is approximately 2% of the simulation duration.
Reliability: This value is 1 if the element has not failed, and 0 if it has failed. Unlike the availability results, no averaging period is required. At any point in time, the element has either failed or has not failed.
Note: These two availability results represent current (or, conceptually, instantaneous) values. They are different from and should not be confused with the availability results that are presented on the Results tab of Reliability elements, which represent the availability over the entire duration of the simulation.
When viewing the current availability results, you must interpret them with caution. This is because they represent the "instantaneous" value of the statistic at any given point in time (as opposed to the cumulative value of the statistic). It is computed by dividing time into "slices" or "windows" for a time period just previous to the plot point (with a length of approximately 2% of the duration). Therefore, the plot is most useful if a large number of Monte Carlo realizations have been run, and you are viewing probability histories A probabilistic representation of the time history of an output in which the percentiles for multiple realizations are plotted.. Viewing single realizations is of limited value.
Similarly, if you were to plot the distribution of one of the availability outputs and note the mean, you would see that the result would most likely be different from the result shown in the Summary section of the Reliability element's Result tab. This is because the distribution results would be based on an instantaneous metric (the availability for the last 2% of the simulation duration), while the Summary results are based on a cumulative metric (the availability over the entire simulation).
These considerations do not apply for the Reliability output, as no averaging period is required: at any point in time, the element has either failed or has not failed.
Learn more
- Availability and Reliability Histories and Statistics
- Availability and Reliability Results Summary
- Causal Analysis
- Defining and Using the Output Interface for a Reliability Element
- Exporting Availability and Reliability Summary Results
- Failure Times Statistics
- Reliability Element Status and Failure Mode Histories and Statistics
- Repair Times Statistics
- Saving and Accessing Reliability Results