The default view for an Array A collection of variables that share common output attributes and can be manipulated in GoldSim elements or input expressions. result is a 2D Chart.
In some cases, however, you may want to view a table of values.If you are viewing a 2D Chart (or 3D Chart), you can view an Array Table by pressing the Table button at the top of the display.
Note: When viewing an Array Result element A Result element that allows you to view "snapshots" of vectors and matrices at particular points in time in both graphical and tabular form., the element "remembers" the last type of view that was displayed, and displays that view when you double-click on it.
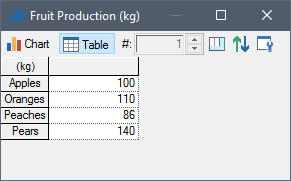
An Array Table for a vector A one-dimensional array. looks like this:

The first column shows the item names for the vector. The units for the vector are in the first cell in the upper left-hand corner of the table.
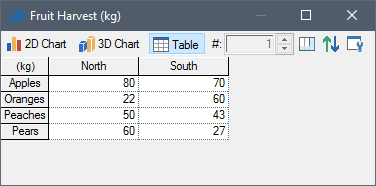
An Array Table for a matrix A two-dimensional array. looks like this:

The units for the vector are in the first cell in the upper left-hand corner of the table. The first row shows the item names for the columns. The first column shows the item names for the rows.
You can increase or decrease the width of a column by dragging the line separating columns to the right or to the left, respectively.
Note: Conditions are displayed in tables as either 1/0, true/false, True/False, TRUE/FALSE, on/off, or High/Low. You select which of these pairs to use on the Results tab of the Options dialog (accessed via Model |Options... from the main menu). The default setting is true/false.
Note: You can control the number of significant figures displayed in tables from the Results tab of the Options dialog (accessed via Model |Options... from the main menu).
By pressing the Rows... and/or Columns... buttons from the Result properties dialog for the Array result, you can select which items in the array are to be displayed in the table (by default, all are displayed).
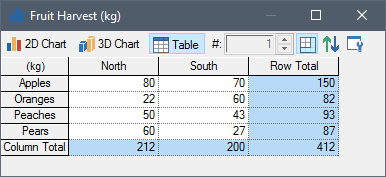
A row/column totals button is available at the top of the display window:

Pressing this button displays the column and row (for matrices) totals in the table:

You can copy the contents of an array table to the clipboard by pressing Ctrl+C. You must first select the cells you wish to copy. You can do so by placing your cursor in one cell and dragging to another location. You can select the entire table by pressing the cell in the upper left-hand corner of the table. Cells that are not adjacent can be selected using Ctrl key when selecting. Selected items will be highlighted in black. You can subsequently paste the table into another application (such as a spreadsheet).
By default, Array results operate on Final Values. That is, the display uses the values at the end of each realization A single model run within a Monte Carlo simulation. It represents one possible path the system could follow through time.. However, by defining Capture Times User-defined points in time during a simulation at which “Final Value” results are captured for result display. The final time point in the simulation is always included as a Capture Time, but additional times can be added., you can display values at any specified time. If you have created Capture Times, an additional drop-list is added to the display window to allow you to select the set of data (i.e., the values at the specified Capture Time) that you would like to display.