When carrying out probabilistic simulations, you may often run hundreds or thousands of realizations. In order to analyze the results, it is often quite useful to classify the realizations into categories. A category is simply defined by a condition relating one or more outputs in the model (e.g., those realizations in which the discount rate was above 3.5%; those realizations in which the profit exceeded $1,000,000; those realizations in which the peak concentration was between 1 mg/l and 10 mg/l).
The power of categories is that once you have defined them, you can use them in two ways:
- Within certain kinds of result charts (e.g., scatter plots, time histories, distributions), realizations from each category can be displayed in a different color (and/or symbol).
- Within all result displays, you can choose to screen out one or more categories, so that the results that are shown (in charts and tables) only include those realizations in the categories which you have chosen to include.
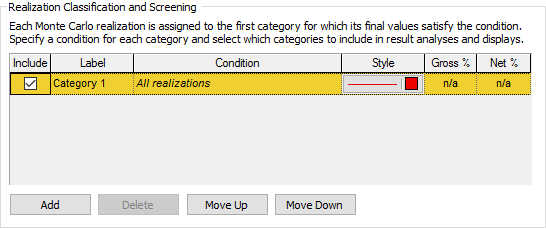
Classification categories are defined at the bottom of the Monte Carlo Result Display Properties dialog:

This dialog can be accessed from the Monte Carlo tab of the Simulation Settings dialog (via the Result Options... button), and is also accessible from result properties dialogs.
By default, all results are placed in a single category (defined as "All realizations"). You can add categories by pressing the Add button. When you do so, it adds a row above the selected row. For each category that you add, you must define a Label and a Condition.
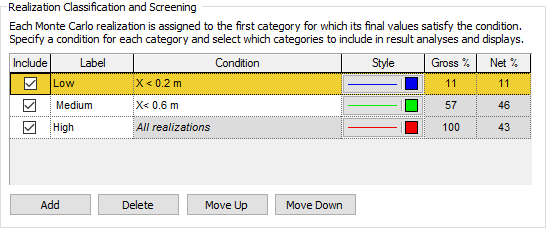
In this example, three categories have been defined:

It is critical to understand how the categories of realizations are created by GoldSim. In particular, the order of the Classification Conditions is important. If multiple Classification Conditions are true for a realization A single model run within a Monte Carlo simulation. It represents one possible path the system could follow through time., the realization is assigned to the category with the first True Condition in the list. Hence, in the example shown above:
- The "Low" category consists of all realizations in which X < 0.2. As indicated by the Net % column, 11% of the realizations fall into this category.
- The "Medium" category consists of all realizations in which X >= 0.2 (and hence they do not fall into the "Low" category above it) AND X < 0.6. As indicated by the Net % column, 46% of the realizations fall into this category.
- The "High" category consists of all remaining realizations (all realizations in which the conditions in the first two categories are false). In this case, it implies that the category consists of all realizations in which X >= 0.6. As indicated by the Net % column, 43% of the realizations fall into this category.
As pointed out above, the Net % columns indicates the percentage of realizations falling into each category. The Gross % column shows the percentage of realizations falling into the selected category and all the categories above it.
Note: If you place your cursor over the Net % field, a tool-tip will display the actual realizations that fall into that category; if you place your cursor over the Gross % field, a tool-tip will display the actual realizations that fall into that category and all the categories above it.
Note: The Gross % and Net % are only shown when the model is in Result Mode The state of a model when it has been run and contains simulation results for a single set of input parameters. (or when the model is paused).
You can use the Move Up and Move Down buttons to change the order of the Conditions (and hence the definition of the categories).
Several points should be noted regarding defining the categories:
- You cannot edit the Condition for (or move) the final category. It always represents "everything else". That is, it represents all realizations that do not fall into one of the previous categories.
- The Condition can be a complex expression, but it must be a scalar An output consisting of a single value or condition. condition.
- You can edit the Conditions in Edit Mode The state of a model when it is being edited and does not contain simulation results., Result Mode or Run Mode The state of a model when it is running. (but not Scenario Mode The state of a model when it contains scenario results, allowing multiple scenarios to be compared.). However, in Result Mode or Run Mode, you cannot reference an output for which Final Values have not been saved.
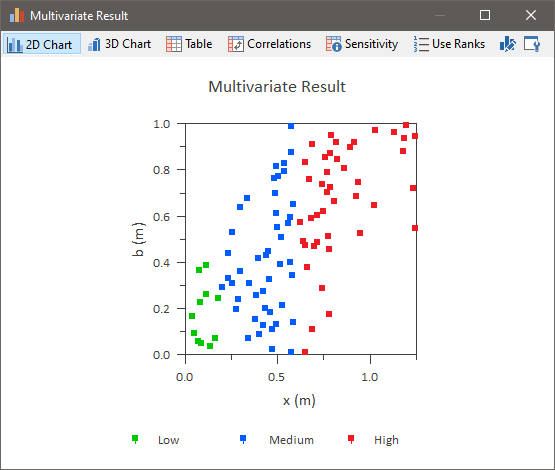
Categories are powerful because in Result Mode, within certain kinds of result charts (e.g., scatter plots, time histories, distributions), realizations from each category can be displayed in a different color (and/or symbol). For example, this Multi-Variate Result (a 2D scatter plot) breaks down the results by category:

Note that for each category, you can select a Style. This is used to control things such as color when plotting the results when you have created multiple categories.
The manner in which these Styles are used is a function of the type of result being plotted.
In addition, you can choose to screen out one or more categories of realizations by clearing the Include checkbox for a category:

When you do so, when showing results (in both charts and tables), only those realizations in the categories which you have chosen to include are displayed.
Note: You can edit the Include box in Edit Mode, Result Mode, Scenario Mode or Run Mode.
Obviously, if you have screened out results in such a way, it is critical that this is made apparent that the results being shown are screened. Hence, when results are screened, this is indicated in the right-hand corner of the status bar A bar at the bottom of the GoldSim interface that provides information regarding the status of the model.. A hash tag (and a comment) are added after "Results":

Learn more
- Using Result Classification and Screening in Time History Results
- Using Result Classification and Screening in Distribution Results
- Using Result Classification and Screening in Final Value Results
- Using Result Classification and Screening in Multi-Variate Results
- Using Result Screening in Array Results