The Cash Flow element computes the net cash flow, the net present value The present value of a project's future cash flow (i.e., the cash value today of future returns) minus the initial investment. (NPV) and internal rate of return A measure of the profitability of a project, venture or undertaking. It represents the discount rate at which the net present value of the project is equal to zero. (IRR) of a cash flow history.This element is used to model the future return of projects, business ventures, and similar undertakings.
The CashFlow.gsm example model can be found in the can be found in the Financial Examples folder in your GoldSim directory (accessed by selecting File | Open Example... from the main menu). It demonstrates the use of the Cash Flow element to simulate a project:

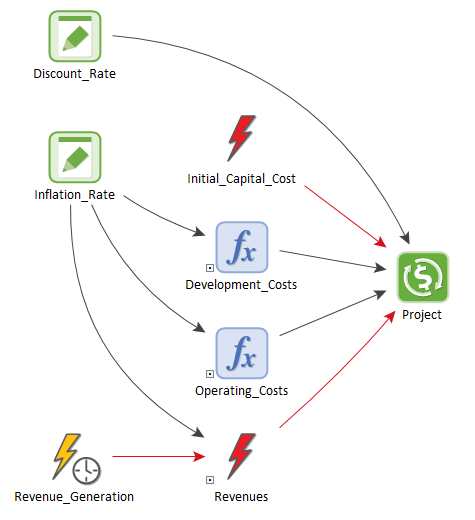
In this case, a capital expenditure (represented by the Initial_Capital_Cost Discrete Change element An element that generates discrete change signals that can subsequently modify stock elements.) is made at the start of the simulation.Development costs occur continuously over the first two years of the simulation and are adjusted upward by the Inflation_Rate over time.Operating costs occur continuously over the remainder of the simulation and also increase by the Inflation_Rate each year.
Revenues occur on a monthly basis, but only after two years. To model this, the Revenue_Generation Timed Event An element that generates discrete event signals based on a specified rate of occurrence. emits an event on a regular basis once per month. The Revenues Discrete Change uses the Revenue_Generation event as a trigger, but ignores events that arrive prior to two years of simulated time. Like costs, Revenues are also adjusted upwards by the Inflation_Rate.
To set up the Cash Flow element, you simply connect continuous and discrete inflows and outflows to the appropriate fields in the element:

Once the cash flows have been specified, NPV and IRR can be calculated by checking the boxes in the Output Definition section of the property dialog. In the case of the NPV, an annual discount rate also needs to be specified.
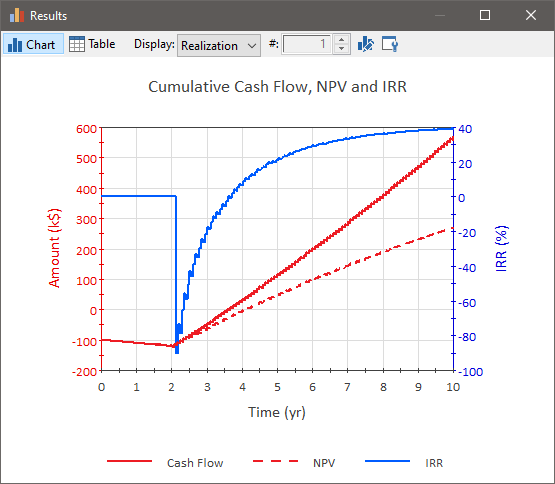
In this model, Cash Flow (the main output of the element), the NPV and the IRR are plotted together in one Time History element:

The IRR graph for the first two years may seem counter intuitive given that the project generates no revenue during that period. However, this is due to the fact that the IRR output displays zero until the first point in the simulation where the calculation actually converges (revenues must occur before the solution will converge).
Learn more
- Example: Comparing Alternatives Using a Cash Flow Element - Repair vs. Replace
- Example: Simulating a Loan Using a Fund Element
- Example: Simulating a Reinsurance Policy
- Example: Simulating a Stock Portfolio
- Example: Simulating Long and Short Positions on a Security
- Example: Simulating Variable Exchange Rates
- Example: Using the Cash Flow Element
- Example: Using the Fund Element
- Example: Using the Insurance Element
- Example: Using the Investment Element
- Example: Using the Option Element