If you create a new Time History Result element in Edit Mode or you click on the Result Properties button when viewing a Time History Result chart or table, the Properties dialog for the result will be displayed. The Result Properties button is the furthest button to the right at the top of the display window:
Note that when you press this button while viewing results, it does not close the result display window you were displaying. Both windows are displayed simultaneously (although you can subsequently close one or the other). When viewing results, any changes you make to the Result Properties are immediately represented in the result display.
The Result Properties dialog is always modal. That is, it cannot be minimized, and with the exception of viewing the result display (which can be displayed simultaneously and share the focus with the Properties dialog), it retains the focus while it is displayed. As a result, you must close the Result Properties dialog before you can edit any other part of your GoldSim model.
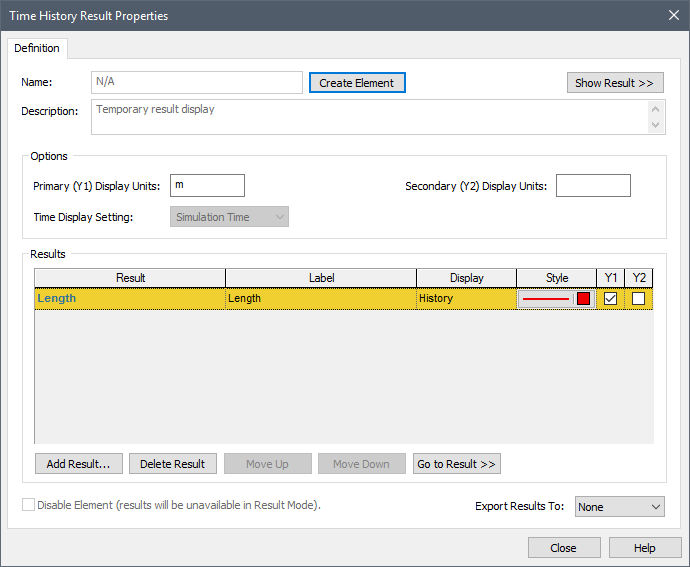
The Result Properties dialog for an interactive (scalar) Time History result looks like this:
You can show the full path for a result (showing the containment hierarchy) by placing your cursor over the Result item to display a tool-tip.
At the top of the page is a button to Create Element. By pressing this button, a Result element is created. When you do so, the key change that will be noticeable is that the Name will now be editable. The Create Element button becomes an Appearance button (which is used to modify the appearance of the element itself).
The Show Result >> button opens a result display window (while keeping the Properties dialog simultaneously open.
The Add Result… button allows you to add results to the chart. Results can be deleted with the Delete Result button. The order in which multiple results appear in the list can be changed using the Move Up and Move Down buttons. Pressing Go to Result >> closes the Properties dialog and selects the element associated with the result in the graphics pane.
For each result in the list, you specify a Style (used in charts), and the Label used in legends in charts and headers in tables.
 Note: The colors used for a
Probability chart (which shows the percentiles for a multi-realization simulation) are not
specified by the Style button. Rather, these are controlled via the
Global Monte Carlo Result Options.
Note: The colors used for a
Probability chart (which shows the percentiles for a multi-realization simulation) are not
specified by the Style button. Rather, these are controlled via the
Global Monte Carlo Result Options.
The Y1 and Y2 checkboxes are used to determine which axis the result is plotted on. If you add a second output that has the same dimensions as the original output, it will automatically be placed on the primary (Y1) axis. If it has different dimensions, it will automatically be assigned to the secondary (Y2) axis. You can add as many outputs as desired to the list. If you add an output whose dimensions do not match those currently assigned to the Y1 or Y2 axes, it will be assigned to neither. As a result, it will not be displayed in the chart (but will be displayed in the table). If you specifically try to assign an unassigned output to an axis, any outputs assigned to that axis with different dimensions will be cleared and the axis will take on the new dimension.
You can also specify the Display Units for the Y1 and Y2 axis (which overrides the display units specified within the element’s property dialog).
The Properties dialog for a Time History Result element has several differences:
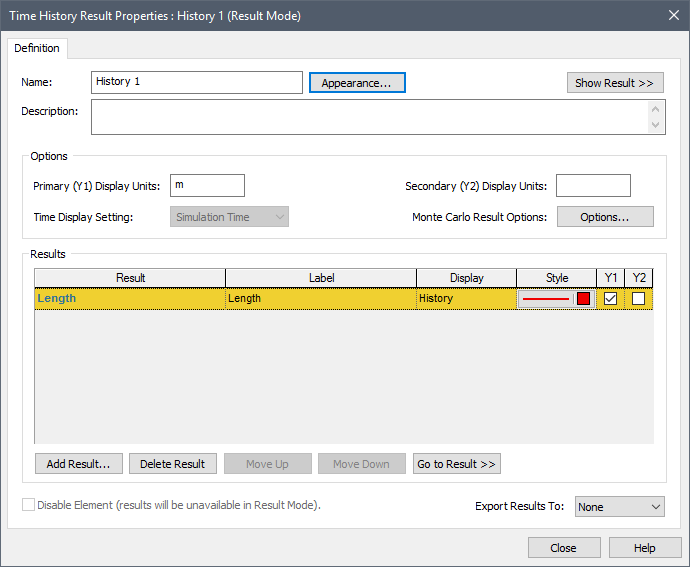
•The Create Element button is replaced by an Appearance button (which is used to modify the appearance of the element itself).
•The Name (and Description) are editable (since this is an element).
•An Options… button is available that provides access to the Monte Carlo Result Display Properties.
•Time History Result elements also have two additional options at the bottom of the dialog: the ability to disable the element, and the ability to export results (to a spreadsheet or text file) at the end of a simulation.
•The Time Display Setting can only be edited while in Edit Mode. It defaults to “Simulation Time”, which is the appropriate setting for viewing standard time histories. However, two additional options are also available (“Reporting Periods” and “SubModel Time”) which can be selected in order to view Reporting Period-based results and SubModel results, respectively, in Time History Result elements.
If you have run multiple realizations, the Properties dialog for a Time History Result dialog has one additional field that is not available for single realization runs: you can specify a Custom Statistic for each output:
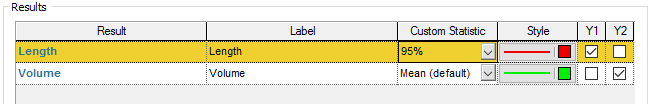
This can then be viewed in result displays.
Learn more about:
Creating and Using Result Elements
Viewing Time Histories of Multiple Outputs
Controlling the Chart Style in Time History Results
Viewing Probability Histories for Multiple Realizations
Controlling Monte Carlo Result Options
Viewing Reporting Period-Based Results in Time History Result Elements
Viewing SubModel Results in Time History Result Elements
Viewing Custom Statistics for Multiple Realizations
Disabling a Time History Result Element
Exporting from a Time History Result Element to a Spreadsheet