If you have saved Time Histories for an output, you can
display a Time History chart by right-clicking on the output (in a browser or the output
interface), or the element (if the output is the element's primary output) and selecting
Time History Result… from the context menu. By default, a chart will be
displayed.
 Note: When viewing a Time
History Result
element, the element “remembers” the last type of view that was displayed,
and displays that view when you double-click on it.
Note: When viewing a Time
History Result
element, the element “remembers” the last type of view that was displayed,
and displays that view when you double-click on it.
Note: Time history results
for simulations with multiple realizations can only be displayed for outputs
that are referenced by Time History Result elements.
If you are viewing a table rather than a chart, you can
view a chart by pressing the Chart button at the top of the display.
A Time History Chart looks like this:

The Time History Chart has a variety of buttons and
controls at the top of the window. Some items are always present, while others
are only shown under certain circumstances (e.g., when viewing multiple
realizations and/or multiple outputs).
The following buttons are always available:
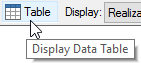
Display Table: Selecting this button switches to a
Time History Table view of the result. Note that when viewing a table, the
Display Table button appears selected; when viewing a chart, the Display Chart
button appears selected.
Edit Chart Style: This button provides access to a dialog for
editing the chart style.

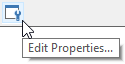
Edit Properties: This provides access to the Result
Properties.
In some situations, you may want to zoom in on a portion of
a chart that is of particular interest. You can, of course, edit the style of
the chart and change the range of the axes which are displayed. GoldSim also
provides a keyboard short-cut to support this.
Condition outputs are either True or False and are typically
used as state variables or flags in a simulation. As a result, in some
situations, you may want to save and plot time histories of conditions. To
facilitate this, when plotting a time history of a condition, GoldSim plots True
as 1 and False as 0.
Like all result charts, you can also control various
attributes of the chart via a context menu. This includes the ability to
turn on and off a legend. The legend uses the Label for the result
defined in the Result Properties page. When viewing multiple results on one
chart, you will always want to display the legend.
You can control the number of significant figures displayed
in result displays from the Results tab of the Options dialog (accessed
via Model |Options… from the main menu).
You can copy the chart to the clipboard by right-clicking
in the chart, and selecting Copy from the context menu.
Alternatively, you can press Ctrl+C while viewing the chart. To export a
chart, right-click in the chart, and select Export… from the context
menu.
Note: When viewing time
history results from a SubModel within the parent model, the Chart display is modified
somewhat, and in some cases provides slightly different options.
Related Topics…
Learn more about:
Controlling the Chart
Style in Time History Results
Viewing the Properties of a
Time History Result
Zooming in on a
Chart
Using
Context Menus in Charts
Viewing Time Histories of
Multiple Outputs
Controlling
Significant Figures and Scientific Notation in Result Displays
Viewing SubModel
Results in Time History Result Elements