This example illustrates the use of a Time Series where the input data represent the instantaneous value of a variable at specified times. This is useful for simulating such things as the price of a commodity (e.g., gold), the price of an asset (e.g., a security such as a stock), or the height of a projectile.
The example can be viewed in the file named BasicTimeSeries.gsm, which can be found in the TimeSeries subfolder of the General Examples folder in your GoldSim directory (accessed by selecting File | Open Example... from the main menu).
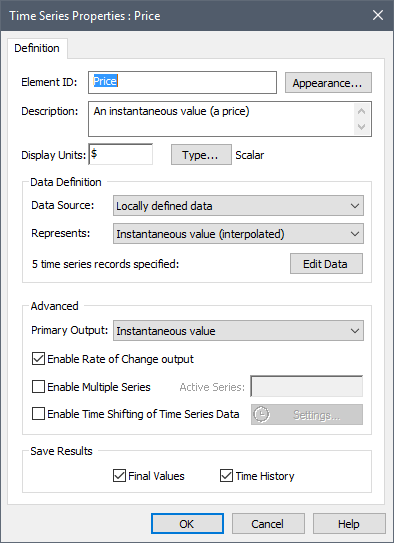
In this example, the input data represent the instantaneous price of a commodity (e.g., gold) at specified points in time:

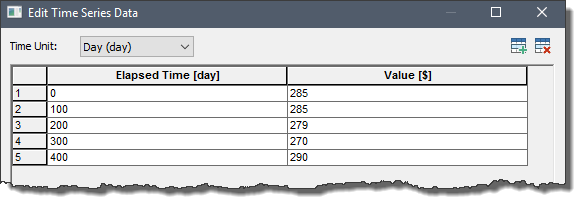
The actual data set looks like this:

The Primary Output For an element with multiple outputs, the output that has the same name as the element. is computed by linearly interpolating between the specified points at every update (i.e., timestep A discrete interval of time used in dynamic simulations.).
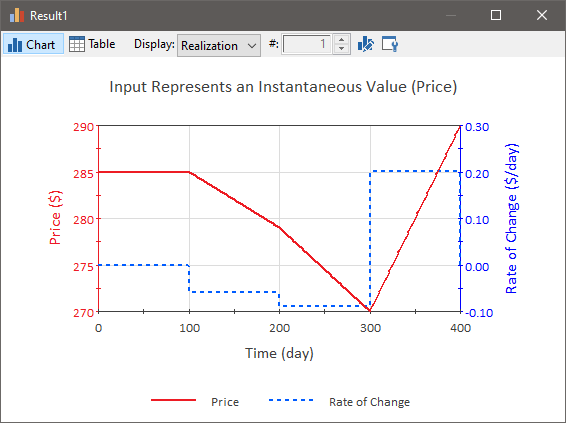
For example, at Time = 250 days, the Value output would be $274.50 (halfway between 279 and 270). The Rate_of_Change output is computed by differentiating the specified values. Hence, between 200 and 300 days, the Rate is -$9/100 days = -0.09 $/day.
The Primary Output and Rate_of_Change outputs for this particular example are shown below:

Note: If the data are specified to represent an "Instantaneous value", the last data point must be at or beyond the end of the simulation. That is, if you have specified time entries as elapsed times, the last data point must be greater than the simulation duration. If you have specified time entries as dates, the last date must be equal to or after the end time for the simulation.