In order to create and test scripts (particularly those with complex branching and looping), it is necessary to be able to step through the script to debug it.
GoldSim facilitates this by allowing you to create breakpoints in your script. A breakpoint provides a mechanism for pausing a simulation in the middle of a script, and subsequently allowing you to step forward (line by line), abort the calculation, or resume the calculation.
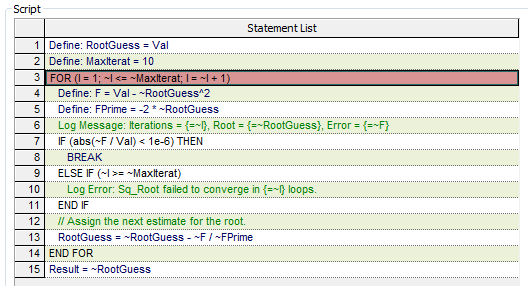
To insert a breakpoint in a script, select (highlight) the line where you would like to insert the breakpoint and press F9, or right-click and select Breakpoint. (You can remove a breakpoint by pressing F9, or right-clicking and selecting Breakpoint again). Lines with breakpoints have a red background in the script statement list. In the example below, there is a single breakpoint inserted (at line 3):

When you run the model, at the point when a breakpoint is reached, the model will pause, and the Script element will be opened.
When a script is paused at a breakpoint, you will notice that the buttons at the bottom of the Script dialog differ from those that are displayed when the model is in Edit Mode The state of a model when it is being edited and does not contain simulation results.:

The next line to be evaluated is outlined in black. Hence, when you first reach a breakpoint, the line where the breakpoint was inserted will be outlined in black. Note that a line that is outlined in black has not yet been evaluated. The calculation is actually paused immediately prior to that line.
From the paused state in a Script element you can do the following to debug the script:
- You can hover your
mouse over variables in the script to see their current values. Note that
if you hover over an If statement (or a While or Repeat-Until statement), it
will display the statement condition (True or False).
When you hover over a For or Do loop, it will display the loop counter.
When hovering over lines to see values and debug the script, it is important to recall that a line that is outlined in black (because you have broken at that line or stepped to that line), has not yet been evaluated. That is, an outlined line indicates that execution is paused immediately prior to the line. - You can press the Resume button or press F5 and execution will proceed from where it is paused (until it reaches a breakpoint again).
- You can abort the model run by pressing the Abort Run button or pressing Shift+F5.
- You can turn off a breakpoint by highlighting it and pressing the Toggle Breakpoints button or pressing F9.
- You can add a new breakpoint by highlighting a line and pressing the Toggle Breakpoints button or pressing F9.
- You can press the Step button or press F10 to step through execution one line at a time.
Breakpoints are not saved with the model. That is, once you close the model file, all breakpoints are intentionally removed. You will have to re-insert them if your debugging takes place over multiple GoldSim sessions.
In some cases, in order to fully understand and debug a script, you may want to print it out. You can do this from a button on the Script dialog.
Log statements, which allow results and text to be written to the model Run Log Text that is stored with a GoldSim model once it has been run. It contains basic information regarding the simulation, and any warning or error messages that were generated., are also useful for debugging.