To illustrate how matrix degradation is simulated, we will consider a simple example. This particular example file, Source2_MatrixDegradation.gsm, can be found in the Contaminant Transport Examples folder in your GoldSim directory (accessed by selecting File | Open Example... from the main menu).
Suppose that 100 steel boxes were buried in shallow soil. Rainfall infiltrating through the soil recharges a shallow aquifer. Each box contains grouted waste containing 10 grams of a soluble contaminant. The boxes are expected to fail at a uniform rate over 5 years. Once they fail, infiltrating water will flow through each box at a rate of 0.5 m3/yr. The grout, however, degrades very slowly (1% per year). For simplicity, we can assume that the species The chemical (or non-chemical, such as bacterial or viral) constituents that are stored and transported through an environmental system in a contaminant transport model. In GoldSim, the Species element defines all of the contaminant species being simulated (and their properties). does not sorb onto the surrounding soil once it is released. At what rate does the contaminant mass enter the aquifer?
To simulate this system in GoldSim, you would do the following:
- Define the contaminant species;
- Define a Source, and specify the number of packages, the inventory of the contaminant species in the Source, the failure rate of the packages, and the matrix degradation rate (of 0.01 yr-1);
- Define a Cell (representing the interior of a box). It will automatically be assigned as an Inventory Cell for the Source;
- Define a Cell representing the aquifer (used here simply as a sink) link it to the Source Cell; and
- Specify the simulation settings (i.e., duration and timestep A discrete interval of time used in dynamic simulations.), and run the model.
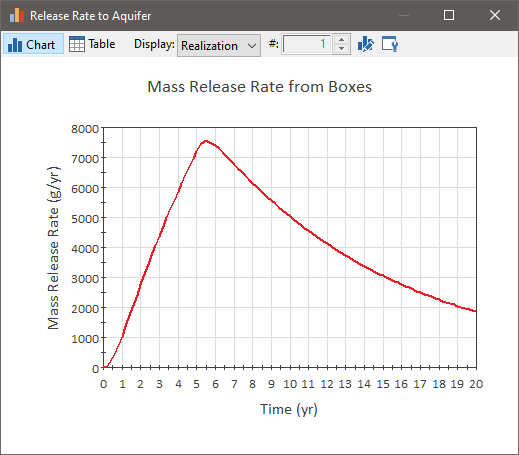
The output of this simulation, in the form of time histories of the mass release of each species from the boxes into the aquifer, is shown below:

The release rate increases almost linearly as packages fail over the first 5 years. Afterward, the release rate decreases as the matrix slowly degrades and releases mass (and at 20 years, not all of the mass has been released). Note that this part of the curve is actually exponential, since a fractional degradation rate results in an exponentially decreasing amount of mass in the Source.
Note: Because this example includes a Source element A specialized element for introducing mass into a contaminant transport model, and is particularly useful when simulating mass emanating from gradually failing engineered barriers., it requires the RT Module. If you are using the CT Module, you will not be able to open the file.