After running our simple Monte Carlo simulation of the Component, we can view the result in a variety of ways. Let's start by viewing a time history plot. We can do so by double-clicking on the Time History Result element:
When you initially view a time history plot of multiple realizations, GoldSim displays a probability history view, showing you the median (black line), and percentiles on the Component’s status over time. In this example, the various histories are simply vertical lines, hence the percentile boundaries are vertical lines.
Things become a bit clearer if we switch from displaying Probabilities” to displaying “All Realizations” (by selecting this option from the Display drop-list at the top fo the chart)::

Each line represents a different realization (with the Component failing at different times). Statistical results on the expected behaviour of a system are produced by combining the results of these realizations.
We can see these statistical results by viewing the Results tab of the Component element:
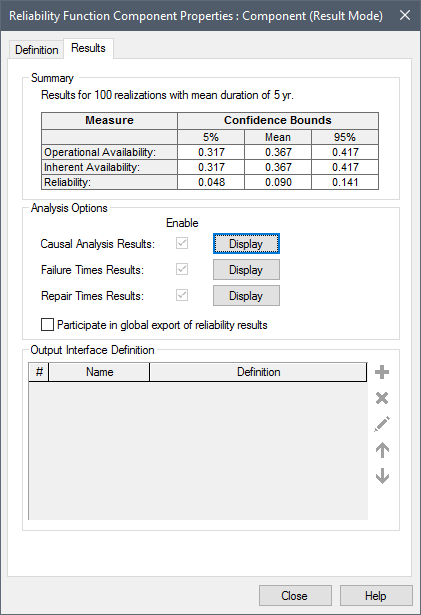
Notice that the reliability value is now nonzero (i.e., there is a small, but nonzero probability that the Component will operate for the full five year period). GoldSim displays Availability and Reliability with confidence bounds, Note that the range between the confidence bounds would shrink if we increased the number of realizations.
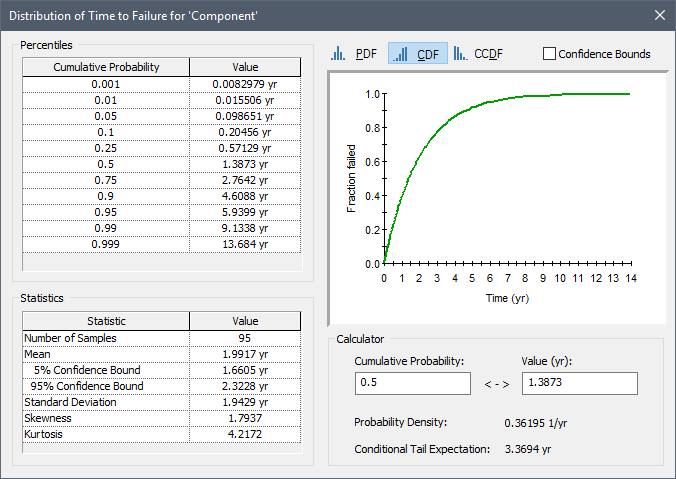
Now click on the Display button to the right of Failure Times Results label. This will display a distribution of the time of failure for the Component: