In some cases, events or other changes in the model may not fall exactly on a scheduled update. That is, some events or changes may actually occur between scheduled updates of the model. These trigger an “unscheduled update” of the model. Unscheduled updates are timesteps that are dynamically inserted by GoldSim during the simulation in order to more accurately simulate the system.
Unlike scheduled updates, unscheduled updates do not normally appear in time history plots and tables. That is, although these timesteps may affect the results (e.g., by making them more accurate at the scheduled timesteps), unscheduled updates of the model are not saved and displayed. Only the scheduled updates are actually saved and displayed.
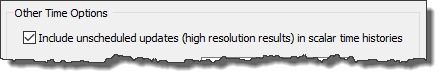
In some cases, however, it may be of interest to see the values of selected outputs at unscheduled updates. To facilitate this, GoldSim provides an option in the Advanced Time settings to save results at unscheduled updates (referred to as “high resolution” results). This option appears at the bottom of the Advanced Time Settings dialog (accessed from the Advanced… button on the Time tab of the Simulation Settings dialog):
By default, the checkbox labeled Include unscheduled updates (high resolution results) in scalar time histories is cleared. If you check this box, GoldSim will save unscheduled updates for time history results (referred to as “high resolution” results) under the following conditions:
•High resolution results can only be viewed from within Time History Result elements. If the output is not referenced by a Time History Result element, high resolution results will not be displayed.
•High resolution results are only available for single realization runs (Deterministic simulations or probabilistic simulation with a single realization).
•High resolution results are only available for scalar outputs.
•The Time Display Setting in the Result Properties dialog for the Time History Result element must be set to “Simulation Time”. High resolution results are not available when viewing Reporting Period-based results.
•High resolution results are only available for results that are added to the Result element before you run the model. If you add a result after you run the model, it will only show results at scheduled updates.
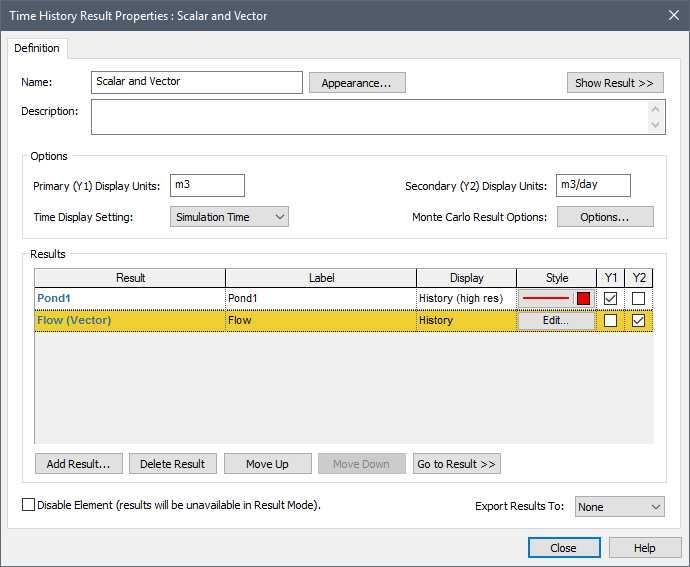
If these conditions are met, and you view a Time History Result element, the Result Properties will look like this:
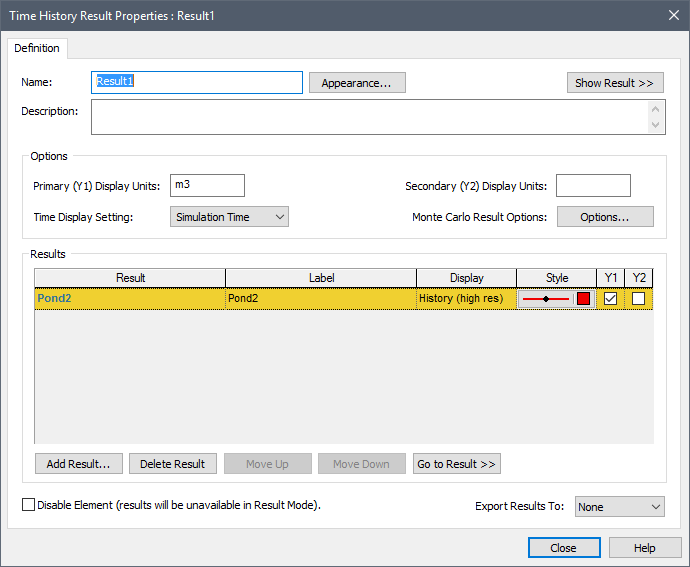
If all necessary conditions are met, the Display column will list “History (high res)”, indicating that the Result element will display high resolution results for that output.
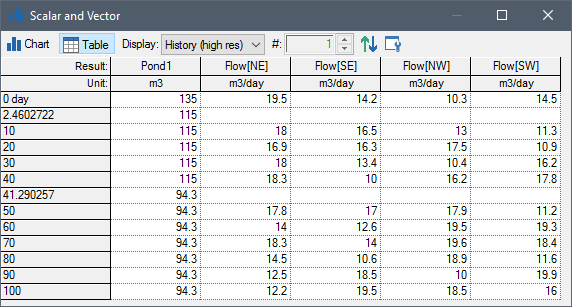
In such a case, the display will include unscheduled updates. In the example below (showing a table display), scheduled updates occur every 10 days (there is a Basic Step of 10 days), but unscheduled updates occur at 2.46 days and 41.29 days:
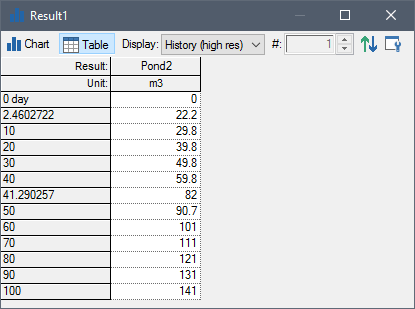
Note that when saving “high resolution” results, to reduce storage requirements, GoldSim does not actually save every unscheduled and scheduled update. Rather, the GoldSim only saves results 1) at each update for which the result is different from the previous update; and 2) the previous update (i.e., the update immediately before the update where the value changed). This information is sufficient to create an accurate chart display. All other updates (representing updates during which the value did not change from the previous value) do not need to be saved.
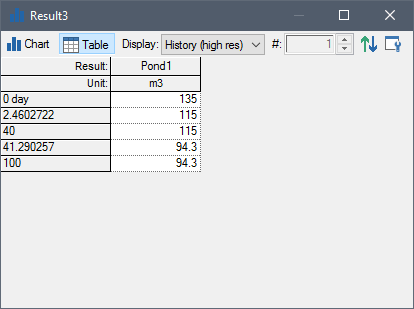
In the example above, the value is changing continuously. Hence, all scheduled and unscheduled updates must be saved. In the example below, however, the value only changes at unscheduled updates (and remains unchanged in between), and hence there is no reason to save all scheduled updates; only those immediately preceding a change (at an unscheduled update) are saved:
The chart corresponding to the table shown above would look like this (symbols are placed at locations where a plot point occurs):

Note that there are no plot points for periods over which the plotted line is horizontal (since the value has not changed) even though there may have been scheduled (and unscheduled) updates during that period that did not affect the value.
The chart below displays the results for the two outputs in the example above in the same chart:

Note that Pond2 actually has more plot points than Pond1 (since it is changing continuously).
In some cases, it may be of value to view the same result with and without unscheduled updates. You can do this by taking advantage of the fact that high resolution results are only available for results that are added to the Result element before you run the model. If you add a result after you run the model, it will only show results at scheduled updates. Hence, to do such a comparison, you would 1) check Include unscheduled updates (high resolution results) in scalar time histories in the Advanced Time Settings dialog; 2) add a result to a Result element; 3) run the model; and 4) add the same result again after running the model. When you do this, the Result element will look like this:

Note that the first item (added before the simulation was run) will display high resolution results, while the second item (added after the simulation was run) will display a normal time history.
In this example, scheduled updates occur every 10 days (there is a Basic Step of 10 days), and unscheduled updates occur at 2.46 days and 41.29 days:

If your Time History Result element included one scalar output and one array, the scalar would provide high resolution results, while the array would not. This would be indicated in the Result Properties dialog:
The Table display would show blank cells for the array at unscheduled updates:
Note that in this case, the high resolution results include all scheduled updates (since a row is provided for each scheduled update point due to the presence in the table of the array).
 Note: High resolution results
(unscheduled updates) are never displayed in Scenario Mode. They are
only available in Result Mode. Hence, you cannot view high resolution
results when comparing scenario results. When comparing scenarios, only scheduled
updates are included in displays.
Note: High resolution results
(unscheduled updates) are never displayed in Scenario Mode. They are
only available in Result Mode. Hence, you cannot view high resolution
results when comparing scenario results. When comparing scenarios, only scheduled
updates are included in displays.
A simple example file illustrating display of unscheduled updates (UnscheduledTimeSteps.gsm) can be found in the can be found in the General Examples/ Running folder in your GoldSim directory (accessed by selecting File | Open Example... from the main menu).
Learn more about: