
GoldSim allows you to view an alternative kind of table view of a distribution result referred to as the result array. This table is accessed by pressing the Show Result Array button in any of the Distribution Result display windows:
A typical result array is shown below:
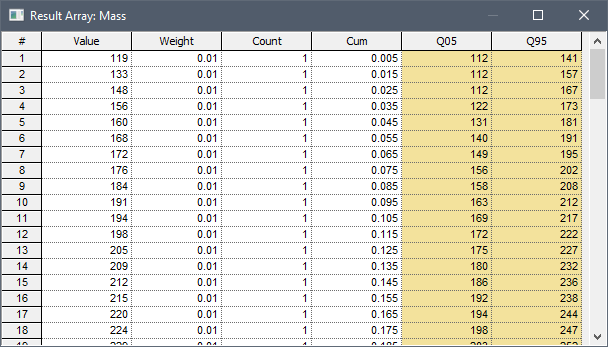
The result array represents a sorted table of all of the results, and is used to produce the charts and statistics for the distribution. The table shows the value, the weight, the number of occurrences of the value, the cumulative probability of the value, and the 5% and 95% confidence bounds for the value at that cumulative probability. (Note, however, that confidence bounds cannot be computed if importance sampling has been used in the model.)
You can increase or decrease the width of a column by dragging the line separating columns to the right or to the left, respectively. If the column is too narrow to display the contents of a cell, holding the cursor over the cell displays a tool-tip with the contents.
Several additional points should be noted regarding Distribution Result Arrays:
•You can copy the contents of the table to the clipboard by pressing the cell in the upper left-hand corner (#) to select the entire table, and then pressing Ctrl+C to copy the contents to the clipboard. You can subsequently paste the table into another application (such as a spreadsheet).
•Values in the table, by definition, are sorted in ascending order. To sort in descending order, double-click on a column header twice. Double-click on a header again to return to ascending order.
•You can control the number of significant figures displayed in tables from the Results tab of the Options dialog (accessed via Model |Options… from the main menu).
The manner in which the results array is created and used is discussed in detail in Appendix B of the GoldSim User’s Guide.
Learn more about:
Controlling Significant Figures and Scientific Notation in Result Displays