
When carrying out probabilistic simulations, you may often run hundreds or thousands of realizations. In order to analyze the results, it is often quite useful to classify the realizations into categories. A category is simply defined by a condition relating one or more outputs in the model (e.g., those realizations in which the discount rate was above 3.5%; those realizations in which the profit exceeded $1,000,000; those realizations in which the peak concentration was between 1 mg/l and 10 mg/l).
Classification categories are defined at the bottom of the Monte Carlo Result Display Properties dialog:
This dialog can be accessed from the Monte Carlo tab of the Simulation Settings dialog (via the Result Options… button), and is also accessible by pressing the Options… button available in the Result Properties dialog of a Distribution Result element.
Once you have defined categories, Distribution results can be displayed by category. The Properties dialog for a Distribution Result with categories defined looks like this:

In addition to showing the result (Mass in this case), the three categories that have been defined are also shown.
 Note: Categories are only
shown if the Distribution Result contains single result. If you add multiple
results, the categories will not be shown.
Note: Categories are only
shown if the Distribution Result contains single result. If you add multiple
results, the categories will not be shown.
By default, the categories are not shown in result displays (the Show box is cleared). If you want to display the categories, you must check the box.
In this particular example, the net number of realizations falling into each category is as follows: 11.8% of the realizations fall into the Low category, 56% fall into the Medium category, and 32.2% fall into the High category. This information is displayed in the the Monte Carlo Result Display Properties dialog after you run the simulation.
When you display a Distribution Result with categories, however, the results are displayed in terms of the gross number (as indicated in the Result Properties dialog). The gross number represents the percentage of realizations falling into the selected category and all the categories above it. Hence, in this example, 11.8% of the realizations fall into the Low category, 67.8% fall into the Low or Medium category, and 100% fall into the Low, Medium or High category.
If you check the Show boxes for all categories, and press the Show Result button, the categories will be included in the displays.
Note that for each category, you can edit the Style via the Monte Carlo Result Display Properties dialog. (The Style selections for each category are displayed in the Distribution Result Properties dialog, but cannot be edited there.)
The Distribution Summary with categories looks like this:

Note that although the Preview Pane will show all categories, the Distribution Summary can only show Percentiles and Statistics for one category at a time. You can choose which of the categories to display from the drop list at the upper left-hand corner of the window.
A Distribution Chart with categories looks like this:

The Labels specified in the Monte Carlo Result Display Properties dialog are used in the legend to label the category results. The label for the result itself (in this case Mass ) is specified in the Result element dialog.
Note that a legend is available for Distribution Charts (you may have to turn it on by right-clicking in the chart and selecting to show the legend from the context menu).
Note that because a Distribution Result displays categories in terms of gross numbers, the final category (in this case High) actually includes all realizations, and hence is identical to the display of the result itself.
For Distribution Tables with categories, the results are listed in separate columns:
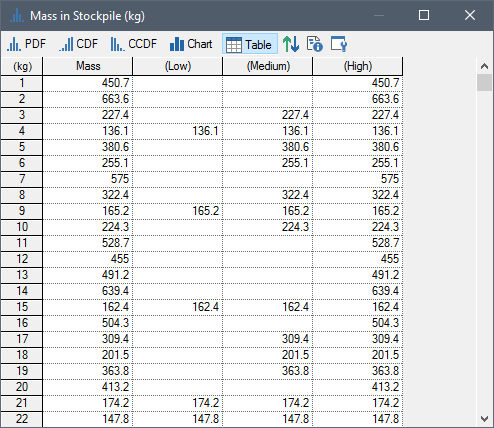
Note that only realizations that fall into each category are displayed. If a realization is not in a category, it is blank. Because a Distribution Result displays categories in terms of gross numbers (and categories are displayed in the table from left to right), if a realization falls into a category, it also falls into all category columns to the right.
Note: You cannot show
Confidence Bounds in the Distribution Chart, Table or the Summary when
displaying categories (the Confidence Bounds button is grayed out).
Within all result displays, you can also choose to screen out one or more categories, so that the results that are shown (in charts and tables) only include those realizations in the categories which you have chosen to include. You can screen a particular category from the results by clearing the Include box at the bottom of the Monte Carlo Result Display Properties dialog:

Note: You can edit the
Include box in Edit Mode, Result Mode Scenario Mode or Run Mode.
Result screening only affects the result itself (if you choose to show categories, the screening does not apply to the category displays). Hence, in the example below, we are screening Low and High categories from the result (labeled Mass), but simultaneously displaying the (gross) category results:

Screened results shown with category results (which are not screened). In most cases, you would likely not show category results when screening.
Note that when screening results, it is the net number of realizations that are screened. Hence, in the example above (in which the Low and High categories are screened), the screened result is based on only those results in the Medium category (56% of the realizations in this example).
Learn more about:
Classifying and Screening Realizations
Controlling the Chart Style in Distribution Results