Condition outputs are either True or False and are typically used as state variables or flags in a simulation. As a result, in some situations, you may want to save and plot distributions of conditions. To facilitate this, when plotting a distribution of a condition, GoldSim plots True as 1 and False as 0.
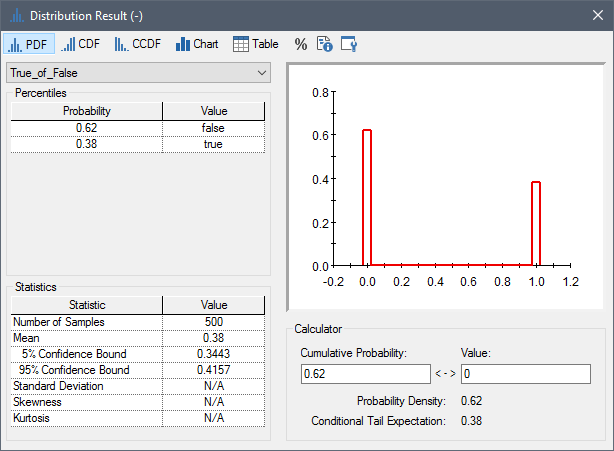
When viewing a distribution of conditions in the Distribution Summary window, within the Percentile portion of the window, GoldSim does not display percentiles; rather it displays the probability of True and False:
The displayed Mean is actually computed as the probability of being True. The other statistics are not computed. GoldSim also displays the 5% and 95% confidence bounds on the Mean.
Learn more about: