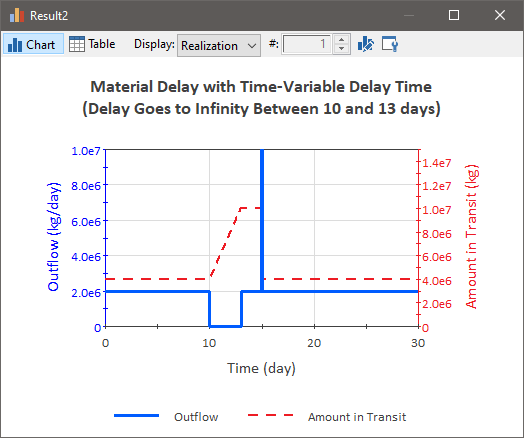
In some cases, the Delay Time for your Material Delay may change as a function of time. For example, suppose a conveyor moves dirt from one location to another. It is loaded at a constant rate of 2E6 kg/day. The conveyor moves rather slowly, so that it takes 2 days for dirt which is loaded at one end to be offloaded at the other end. Let’s further assume that at 10 days, the conveyor breaks down, and it takes 3 days to fix it. The figure below plots the Outflow Rate and the Amount in Transit for this simple model:

To understand this result, let’s first examine the Outflow curve. Prior to time = 10 days, the Outflow Rate is constant and equal to the Inflow Rate (i.e., it is at steady state). At time = 10 days, the conveyor shuts down, and hence the Outflow goes to zero. After time = 13 days, the conveyor starts up again, and the Outflow resumes its original rate. At time = 15 days, however, a large spike of material outflows, and then the Outflow returns to the steady state value again. Where did this spike come from?
To understand this, examine the Amount in Transit output. Notice that while the conveyor is stopped, the Amount in Transit continues to increase. This is because the Inflow Rate has remained constant at 2E6 kg/day. This mass has to go somewhere (Material Delays conserve mass), so it is “piled up” at the start of the conveyor. Conceptually, it is as if the conveyor was continuing to be loaded, even though it was no longer moving (i.e., a large pile was growing on the first section of the conveyor. It is this “pile” that is released as a spike at time = 15 days (the height of the spike is actually off the scale shown here). Once the conveyor restarted, it took 2 days for the pile to traverse the conveyor.
Of course, this simple example is not very realistic. In reality, they would stop loading the conveyor (e.g., they would pile it next to the conveyor). This is true, and in that case, we would need to control the Inflow Rate. In the simple model above, the Inflow Rate was assumed to remain constant in order to explain the functionality of the element. A more realistic way to represent this particular system is to represent an inflow limit for the Material Delay (that might change with time). In this example, the inflow limit would go to zero when the conveyor stopped.
Learn more about: