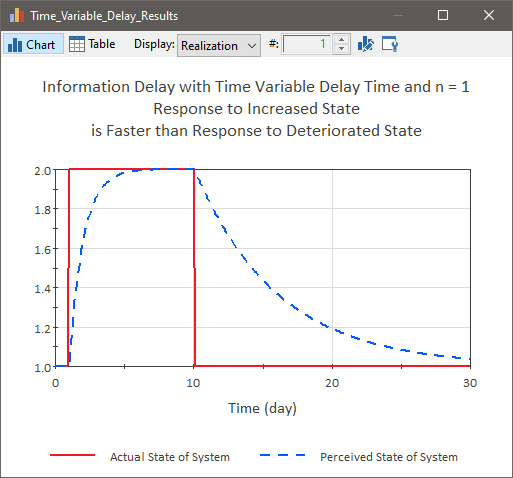
In some cases, the Delay Time for your Information Delay may change as a function of time. For example, a company may recognize and respond to improving economic conditions faster than deteriorating conditions. The figure below shows a situation in which the time to perceive a change in the system is faster when the current perceived state is less than the actual state (i.e., the state of the system has improved) and slower when the current perceived state is greater than the actual state (i.e., the state of the system has deteriorated).

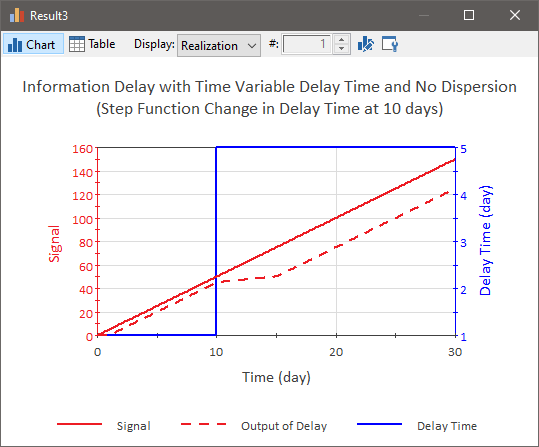
To better understand how an Information Delay behaves when the Delay Time changes, it is worthwhile to consider a simple example. In this example, we assume no dispersion in the signal. The signal is a linear function of time. Prior to 10 days, the Delay Time is equal to 1 day. After 10 days, the Delay Time is equal to 5 days. The simulated result is shown below (Info_Delay is the output of the Delay element):

To understand this result, let’s assume that the signal represents some measurement, and before the measurement gets reported, it must pass through a chain of ten individuals. Prior to 10 days, it takes 1 day for the information to move through these individuals. After 10 days, it takes 5 times longer (e.g., perhaps they change from working 5 days per week to one day per week). Any measurement received before 9 days is delayed exactly one day. Any measurement received after 10 days is delayed exactly 5 days. Any measurement received between 9 and 10 days (during the tenth day), is delayed from 1 to 5 days. Measurements received early in the 10th day nearly made it all the way through the chain of individuals before their work rate decreased (the delay time increased). These signals are delayed for a little more than 1 day. Measurements received late in the 10th day were not very far along the chain of individuals before their work rate decreased. These signals are delayed nearly 5 days.