GoldSim’s scenario modeling capability allows you to directly compare results generated by different sets of input parameters. In effect, when you use this capability, your model can store (and subsequently compare) multiple sets of results (and inputs).
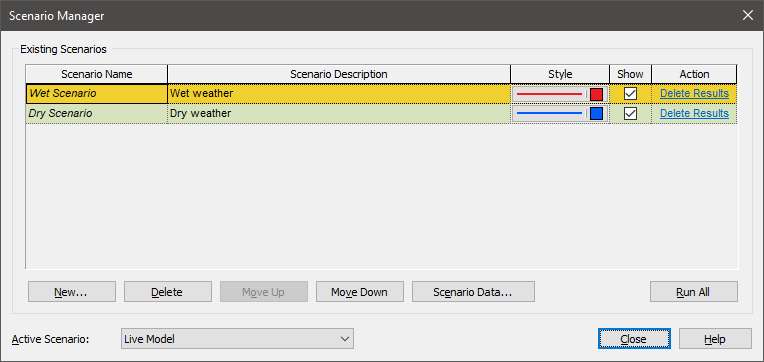
When a model is in Scenario Mode, Final Value Result elements can be used to view scenario results as one of the “dimensions”. In order for scenario results to be displayed in a Final Value Result element, the Show button must be checked for each scenario to be displayed in the Scenario Manager (accessed from the main menu (Run | Scenario Manager…) or by pressing F7):

In this example, the Show box is checked for both scenarios, so bothe will be displayed in results.
 Note: Capture Times
cannot be viewed in Scenario Mode (i.e., only the Final Result can be
viewed). That is, if you are running scenarios and viewing results using
Final Value Result elements you cannot view results for scenarios at specified
Capture Times. You can only view scenario results for the Final
Result.
When you are viewing a Final Value Result element in Scenario Mode, when viewing a table you will be able to select “All Scenarios” (or a single scenario) for the Rows, Columns or Layer. When viewing a chart you will be able to select “All Scenarios” (or a single scenario) for the Series or Points, or select a single scenario for the Layer. This provides a great deal of flexibility for displaying scenario results.
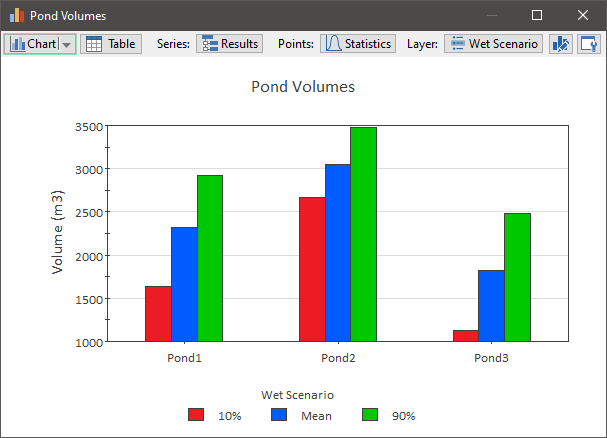
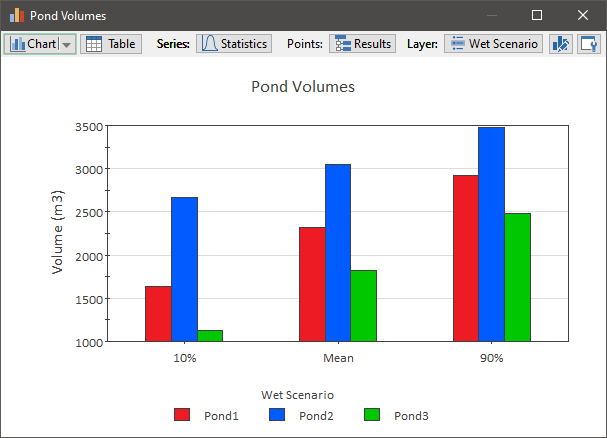
For example, if you were viewing multiple outputs and multiple realizations, you could choose to display a chart showing all outputs and all statistics for a particular scenario (in two different ways):
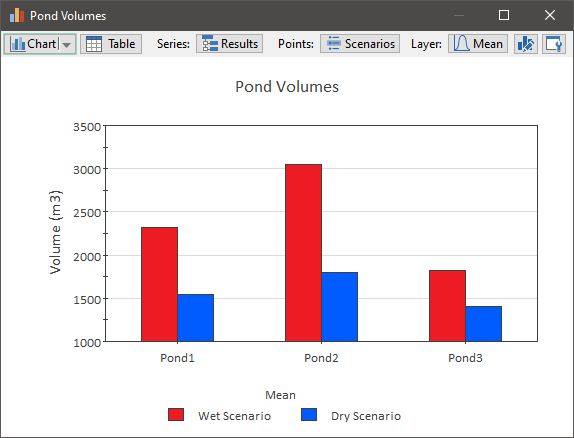
Alternatively, you could choose to display a chart showing all outputs and all scenarios for a particular statistic (in two different ways):
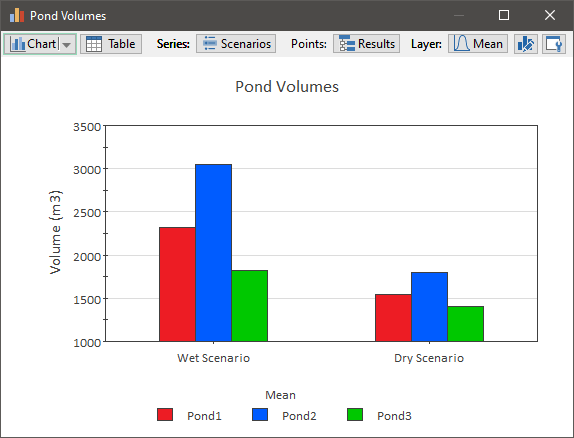
Finally, you could choose to display a chart showing all scenarios and all statistics for a particular output (in two different ways):
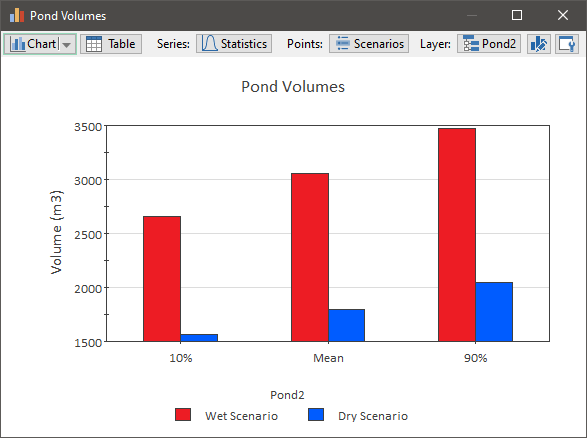
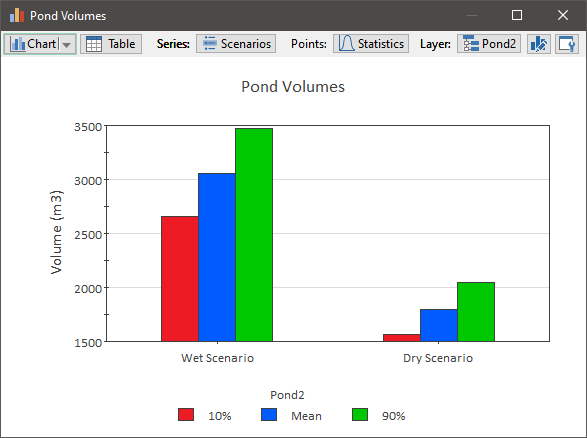
Of course, we could also display other types of charts (bar charts, stacked bar or column charts, or pie charts).
 Note: When you define a
scenario in the Scenario Manager you can specify a Style. When viewing
other types of results (Time History, Distribution) these are used to define the
color and style of the items (e.g., lines) representing that scenario in the
chart. However, this does not apply for Final Value results. The colors of
the bars, columns or pie slices in a Final Value chart are auto-selected and
cannot be controlled by the user.
Learn more about: