
GoldSim has powerful charting capabilities that allow you to customize the appearance of each chart. This includes adding headers and footers, and changing axis scales and labels for scatter plots. Most of these attributes can be edited by pressing the Edit Chart Style button at the top of the Multi-Variate display window:
Pressing this button (or right-clicking in a chart and selecting Edit Chart Style…) provides access to the following dialog for editing the various chart properties:
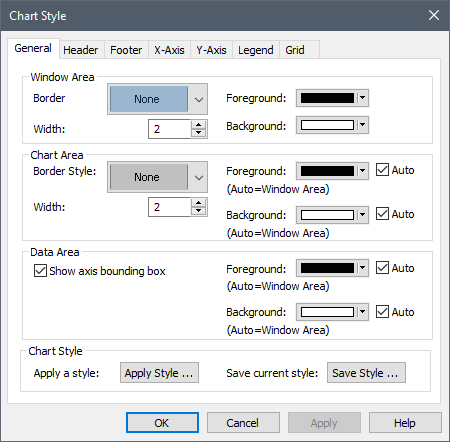
This dialog is common to all types of charts, and is discussed elsewhere.
For Vector Charts, the bar chart color is fixed and cannot be edited (solid red). You can, however, modify which items are actually included in the chart. Pressing the Rows… button from the Result Properties dialog for the Array result displays the following dialog:
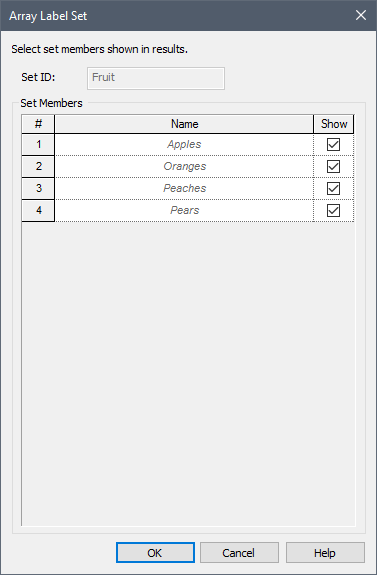
 Note: This dialog can also be
accessed from the main GoldSim menu (by selecting Model | Array Labels… and then
selecting the appropriate Array Label Set). When you access the dialog in
this manner, the Style for each item is also displayed, but changing these has
no impact on Vector Charts, since the Style is fixed.
Note: This dialog can also be
accessed from the main GoldSim menu (by selecting Model | Array Labels… and then
selecting the appropriate Array Label Set). When you access the dialog in
this manner, the Style for each item is also displayed, but changing these has
no impact on Vector Charts, since the Style is fixed.
By default, the Show box is checked for all items. If you clear this box, the row item will not be displayed in charts (or tables).
For Matrix Charts, the bar chart color for each column can be specified by pressing the Columns… button from the Result Properties dialog for the Array result. The following dialog will be displayed:

Note: This dialog can also be
accessed from the main GoldSim menu (by selecting Model | Array Labels…
and then selecting the appropriate Array Label Set).
The Style column controls the style for the bars for the columns in the Matrix Chart. You can also modify which column items are actually included in the chart. By default, the Show box is checked for all items. If you clear this box, the column item will not be displayed in charts (or tables).
Learn more about: