
After running a simulation, GoldSim provides a number of ways to view the results.
Right-clicking on an element with a primary output (in the graphics pane or browser) or on a specific output (in an output interface or a browser) which has been saved will provide a context menu for displaying results.
Depending on the type of output and which results have been saved, different options will be displayed at the top of the menu.
Clicking on one of the first four items in this menu displays the results for the selected object, either in the form of a chart or a table (depending on user-defined default settings).
 Note: You can also add Result
elements to you
models. Result elements display a particular result that you have
specified when you click on them. Result elements are discussed in detail
in Chapter 8 of the GoldSim User's Guide.
Note: You can also add Result
elements to you
models. Result elements display a particular result that you have
specified when you click on them. Result elements are discussed in detail
in Chapter 8 of the GoldSim User's Guide.
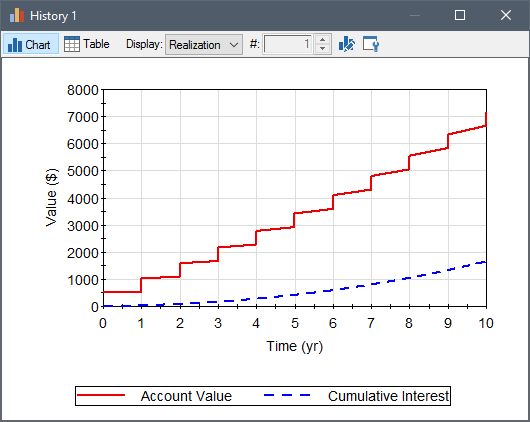
Time History results show the "history" of a particular output as a function of time, and are probably the most common form of result display you will see:
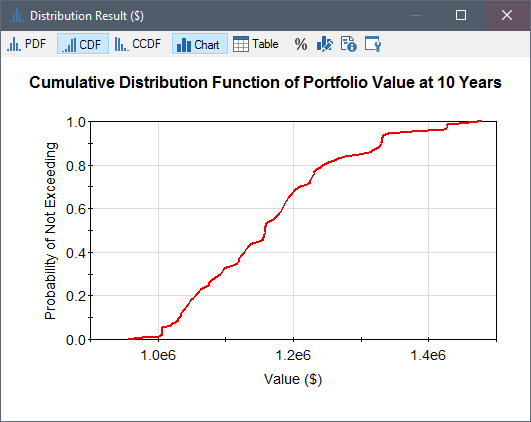
You can also view probability distributions of a Final Value. This result is only available if you have carried out multiple realizations:
Other result options allow you to view bar, column, pie and scatter plots.
Learn more about: