In order to discern the range of possible outcomes, given the salary and spending habits described in the previous steps, we will run multiple realizations of the system using Monte Carlo simulation.
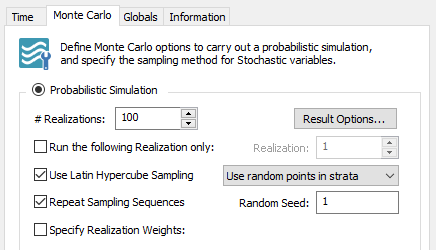
For this simple simulation, 100 realizations will provide a good sample to work with. To change the number of realizations, return to Edit Mode (press F4), and open the Simulation Settings dialog (press F2). Click on the Monte Carlo tab, and change the “# Realizations” to 100:
Close the dialog.
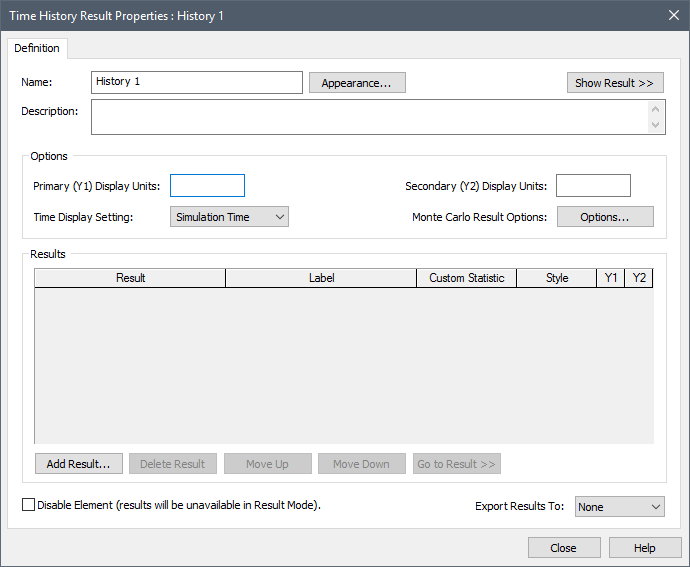
In order to view time histories involving multiple realizations, we need to create a Time History Result element. A Time History Result is inserted by right-clicking in the graphics pane, and selecting Insert Element|Results|Time History Result from the context menu:
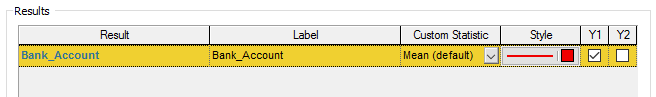
Press the Add Result… button and select Bank_Account. It will then appear in the list like this:
We can use the Time History Result element to customize the appearance of our plot. We will make just two small changes. Change the name of the element to “Time History Result” (result element names can have spaces) and change the Label for the Result to “Account Value”:
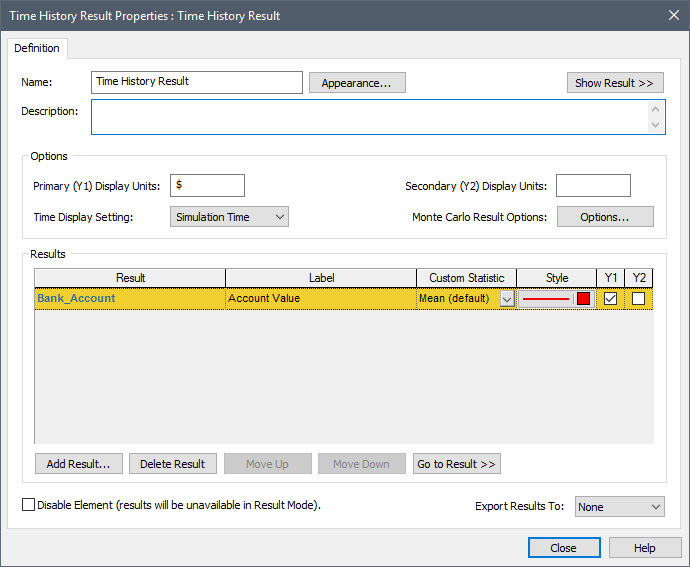
The Name will become the chart header and the Label will be used to label the result on axes and legends.
After closing this dialog you can run the model (by pressing F5).
After running our simple Monte Carlo simulation, we can view the results in a variety of ways. Let's start by viewing a time history plot. We can do so by double-clicking on the Time History Result element:

When you initially view a time history plot of multiple realizations, GoldSim displays a “Probabilities” view, showing you the median (black line) and percentiles of the output's value over time.
We can select “All Realizations” from the Display list at the top of the chart to display all 100 realizations:

Each line represents a different realization (different, but equally likely, possible future). As can be seen, there is a wide range of possible outcomes, from ending up with a negative balance of nearly $40,000 to a positive balance of nearly $50,000.
One question we might want to answer is: "Given my salary and spending habits, what is the probability of having a negative balance after 2 years?". We can easily answer this question by plotting a distribution of the value of the Bank_Account at the end of the simulation (i.e., after 2 years).
We can do so by right-clicking on the Bank_Accout element and then left-clicking on Distribution Result… in the context menu. This will display the following:

This shows the mean, standard deviation, percentiles and other statistics. In the Calculator section, go to the Value field and enter 0:
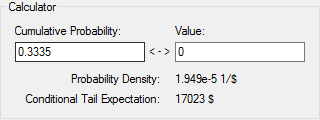
This displays the probability of the result being less than the specified Value. In this case, it indicates that there is about a 33% chance that the account will have a negative balance after 2 years.
 Note: Your result will be
different due to different random number seeds.
Note: Your result will be
different due to different random number seeds.
The file (named Fund.gsm) that we just built can be found in the can be found in the Financial Examples folder in your GoldSim directory (accessed by selecting File | Open Example... from the main menu).