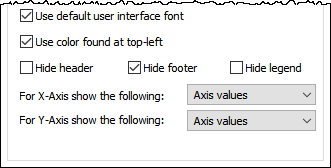
In addition to the key display options in the Result Window control dialog (e.g., chart or table, type of chart to display), you have a number of additional options for controlling the appearance of the embedded result:
Use default user interface font. If this box is checked, the default GUI font and font size used by the operating system are used for the various labels in the embedded chart. Otherwise, the font and font size specified in the Result element is used.
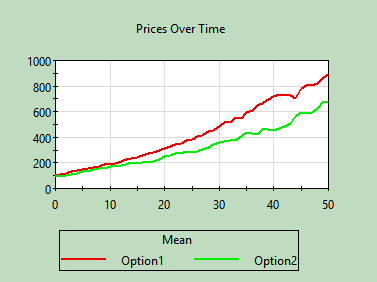
Use color found at top-left. If this box is checked, GoldSim uses the background Dashboard color found at the top-left corner of the embedded window and forces the Data area to be white; otherwise it uses the colors specified within the result element. To illustrate this, consider the example below. Here is an embedded result (superimposed on a dark Dashboard background) with the box checked:
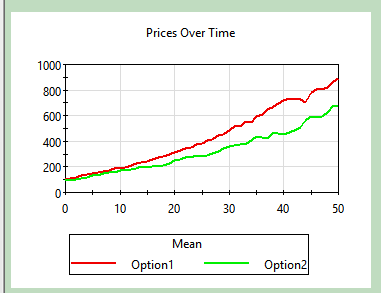
Here is the same embedded result with the box cleared:
Hide header, Hide footer, Hide legend. These boxes allow you to override the settings defined in the Result element to control whether or not the header, footer are hidden in the embedded chart (they do not apply to tables). Note, however, that these can only force something that is shown in the Result element to be hidden in the embedded chart. If the item is already hidden in the Result element, clearing this box has no impact (i.e., it will not force the item to be displayed).
For X-Axis show the following. This determines what is shown on the X-axis in the embedded chart (it does not apply to tables). The choices are:
Axis title and values: Displays the axis title and values.
Axis values: Displays only the axis values (but not title).
Show nothing: Displays neither the axis titles nor the axis values.
Note, however, that this can only force something that is shown in the Result element to be hidden in the embedded chart. For example, if the X-Axis is already hidden in the Result element, selecting to display the Axis here has no impact.
For Y-Axis show the following. This determines what is shown on the Y-axis in the embedded chart (it does not apply to tables). The choices are:
Axis title and values: Displays the axis title and values.
Axis values: Displays only the axis values (but not title).
Show nothing: Displays neither the axis titles nor the axis values.
Note, however, that this can only force something that is shown in the Result element to be hidden in the embedded chart. For example, if the Y-Axis is already hidden in the Result element, selecting to display the Axis here has no impact.