Viewing a Specialized Distribution Result
Several elements in GoldSim (e.g., Milestones, Reliability elements) can produce a specialized Distribution Result.
A specialized Distribution Result looks like this:
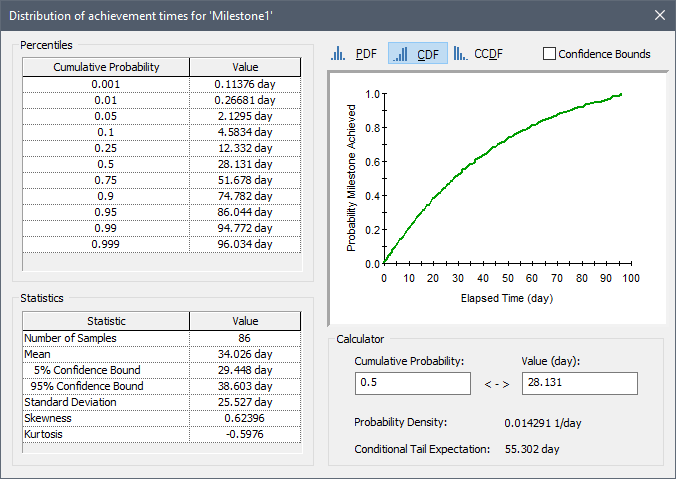
The chart pane (in the upper right-hand corner of the screen) shows a chart view of the distribution.
The left side of the screen displays a common set of percentiles for the distribution (in terms of Cumulative Probability/Value pairs).
The statistics for the distribution (Mean, 5% and 95% Confidence Bounds on the Mean, Standard Deviation The square root of the variance of a distribution. The variance is the second moment of the distribution and reflects the amount of spread or dispersion in the distribution., Skewness A measure of the symmetry of a distribution. A symmetric distribution has a skewness of 0. The skewness is a function of the third moment of the distribution., and Kurtosis A measure of how "fat" a distribution is relative to a normal distribution with the same standard deviation. A normal distribution has a kurtosis of 0. The kurtosis is a function of the fourth moment of the distribution.) are shown directly below the distribution's percentiles. The significance of these statistics is described in Appendix A of the GoldSim User's Guide. The number of realizations (Number of Samples) is also indicated.
The Calculator section of the window allows you to compute the value associated with a particular percentile or the percentile associated with a particular value:
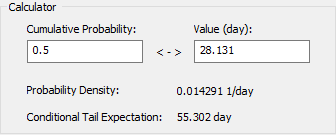
The Calculator also displays the Probability Density and the Conditional Tail Expectation The expected value of the output given that it lies above a specified quantile. That is, it represents the mean of the worst 100(1 - alpha)% of outcomes, where alpha is the specified quantile. for the specified Cumulative Probability/Value pair. The Conditional Tail Expectation is the expected value of the output given that it lies above a specified Cumulative Probability. That is, it represents the mean of the worst 100(1 - α)% of outcomes, where α is the specified Cumulative Probability.
Note: Calculation of the Conditional Tail Expectation is discussed in detail in Appendix B of the GoldSim User's Guide.
The three buttons at the top of the dialog (PDF Probability Density Function. A function whose Y-axis can be interpreted as providing the relative likelihood that the value of a random variable would be equal to value specified on the X-axis. Hence, the dimensions of the Y-axis are the inverse of those of the X-axis (i.e., the probability per unit length of the X-axis)., CDF Cumulative Distribution Function. The integral of a probability density function. and CCDF Complementary Cumulative Distribution Function. The complement of the cumulative distribution function (which is the The integral of a probability density function).) allow you to view the chart as a probability density function, a cumulative distribution function or a complementary cumulative distribution function The integral of a probability density function., respectively.
Note: The algorithm used to create a PDF plot is discussed in detail in Appendix B of the GoldSim User's Guide.
Checking the Confidence Bounds box displays confidence bounds on CDFs and CCDFs (they cannot be displayed for PDFs):
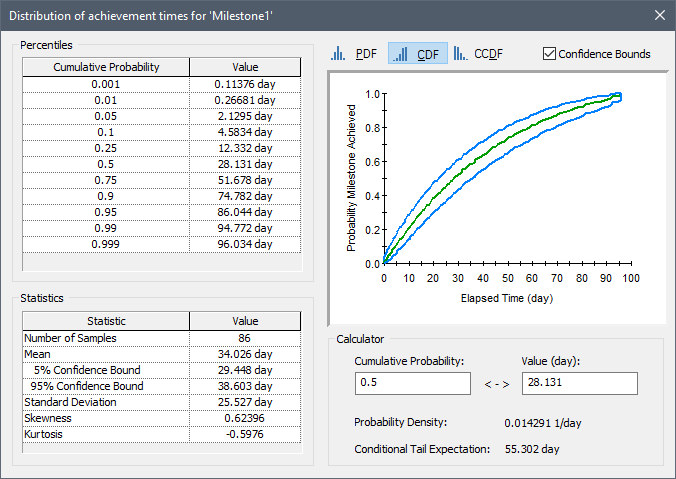
These bounds reflect uncertainty in the probability distribution A mathematical representation of the relative likelihood of a variable having certain specific values. It can be expressed as a PDF (or a PMF for discrete variables), CDF or CCDF. due to the finite number of Monte Carlo realizations (as the number of realizations is increased, the uncertainty in the distribution decreases). The confidence bounds represent the 5% and 95% confidence limits on the distribution. The calculation of confidence bounds is discussed in detail in Appendix B of the GoldSim User’s Guide. Note that confidence bounds cannot be displayed if importance sampling An algorithm that biases sampling of probability distributions in order to better resolve the tails of the distributions. has been used in the model.