Many complex models will utilize vectors and matrices, collectively referred to as arrays. GoldSim allows you to view array A collection of variables that share common output attributes and can be manipulated in GoldSim elements or input expressions. results in both graphical and tabular form.
Note: Final Value results are more flexible for viewing arrays and for the most part make this result display redundant (i.e., this is a legacy feature). It does have two minor features not available in Final Value elements (the ability to sum rows and columns and the ability to produce 3D charts), but for most applications Final Value displays are much more powerful (e.g., they are available in Scenario Mode The state of a model when it contains scenario results, allowing multiple scenarios to be compared. and can produce a wider variety of chart types).
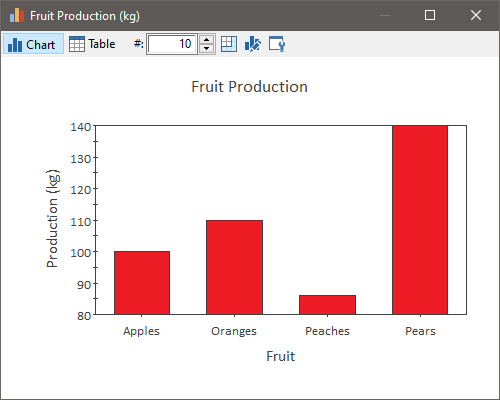
A chart display of a vector A one-dimensional array. looks like this:

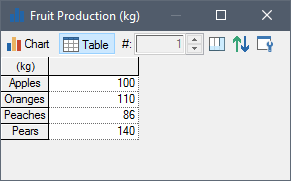
In tabular form, the vector looks like this:

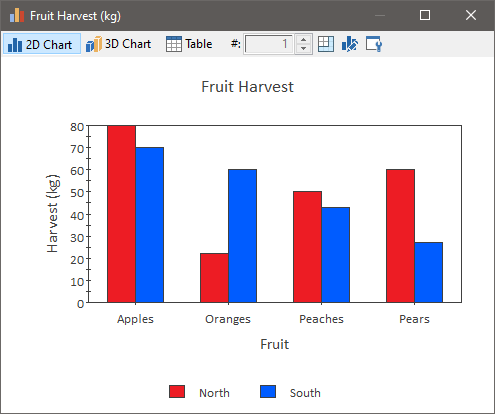
One form of a chart display for a matrix A two-dimensional array. looks like this:

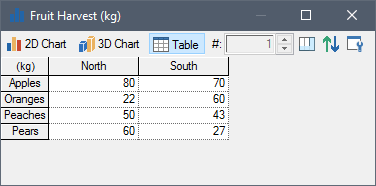
In tabular form, the matrix is displayed as follows:
